Overview
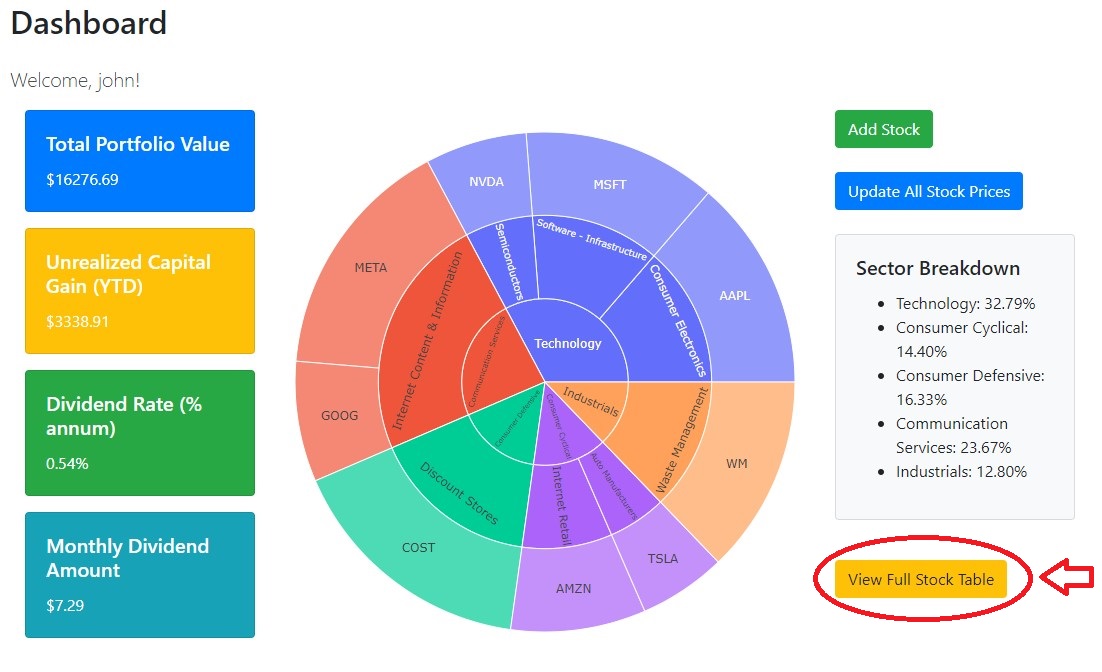
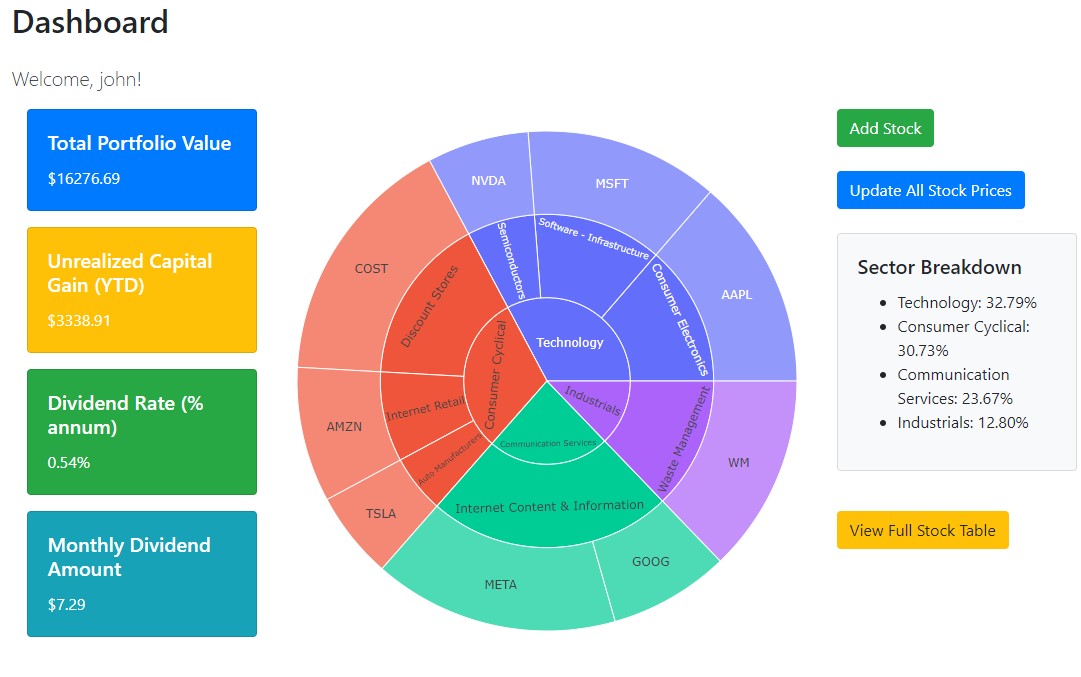
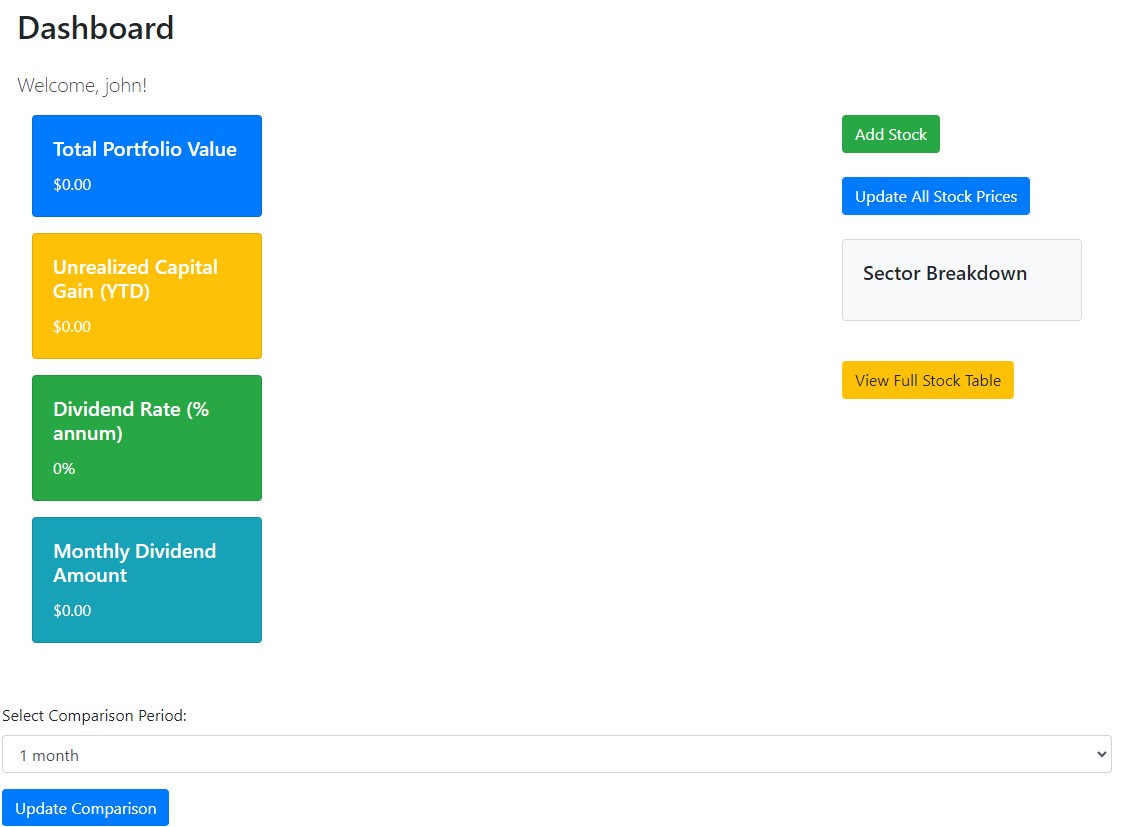
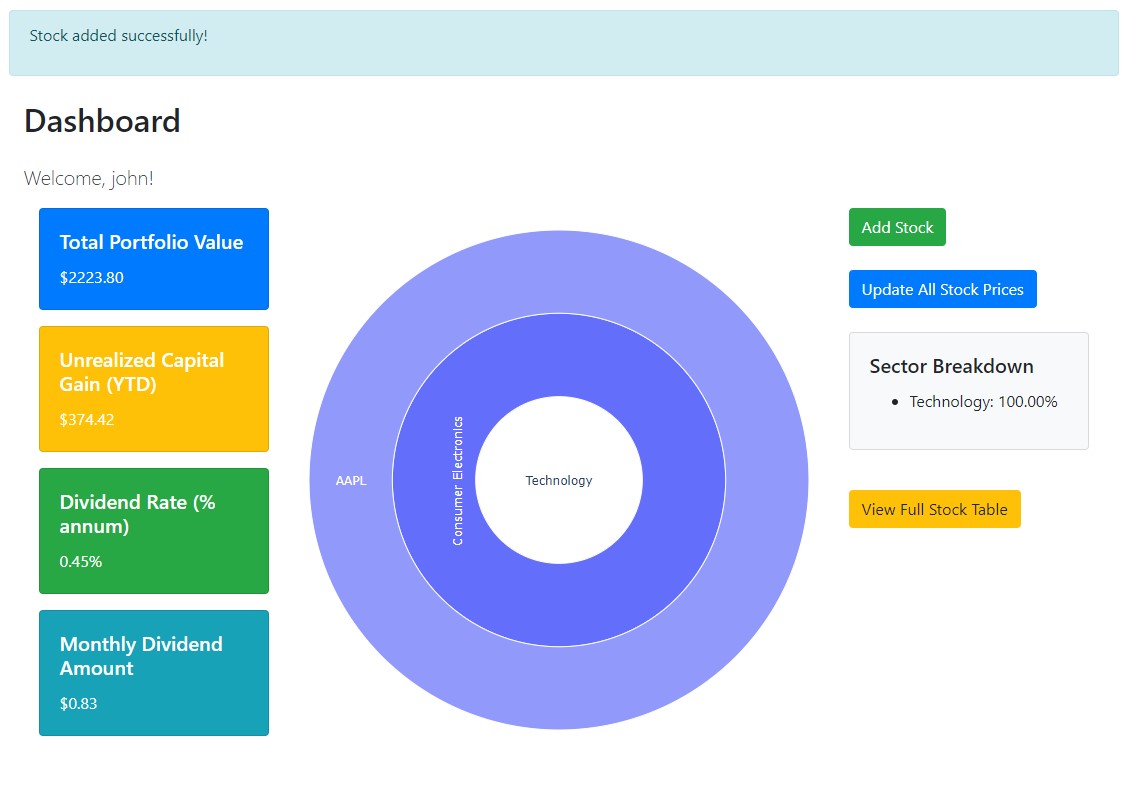
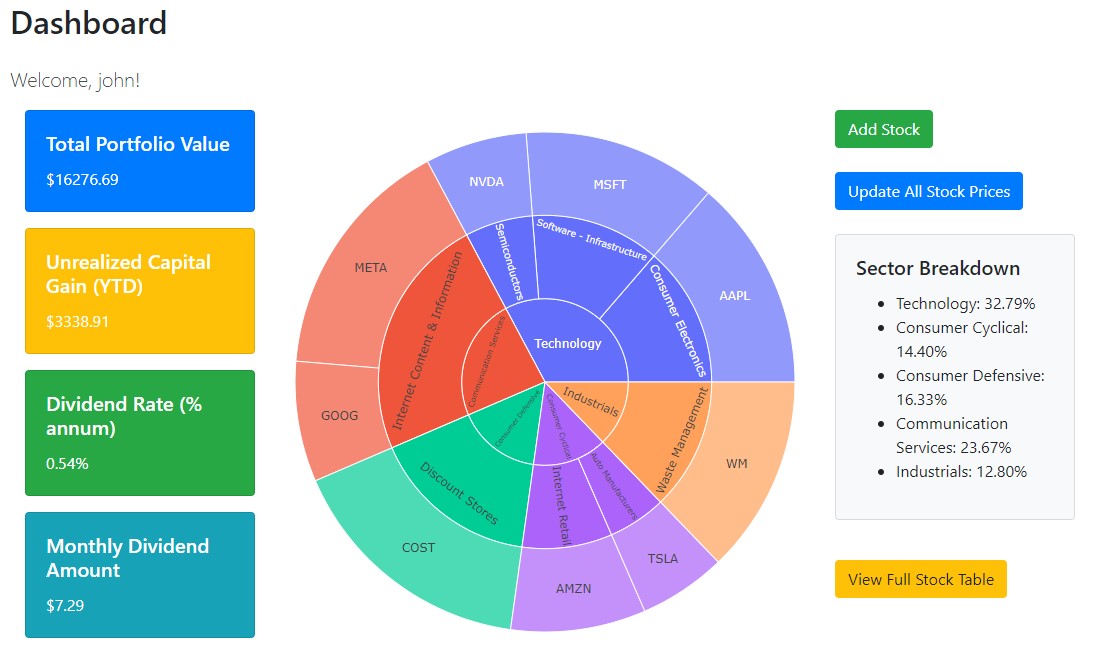
StockAssembler provides a comprehensive solution for managing your stock portfolios. The Dashboard allows you to visualize your portfolio's composition, including sector and sub-sector breakdowns, as well as relative weighting. This helps you gain insights into the distribution of your investments and make informed decisions.
Total Portfolio Value
$18191.87
Unrealized Capital Gain (YTD)
$-924.31
Dividend Rate (% annum)
0.64%
Monthly Dividend Amount
$9.66
Sector Breakdown
- Technology: 29.55%
- Consumer Cyclical: 30.99%
- Energy: 3.75%
- Communication Services: 22.89%
- Industrials: 12.83%
The Comparison Chart allows you to compare the performance of your portfolio against various market indexes, such as the S&P 500. This feature provides a visual representation of how your investments are performing relative to major benchmarks.
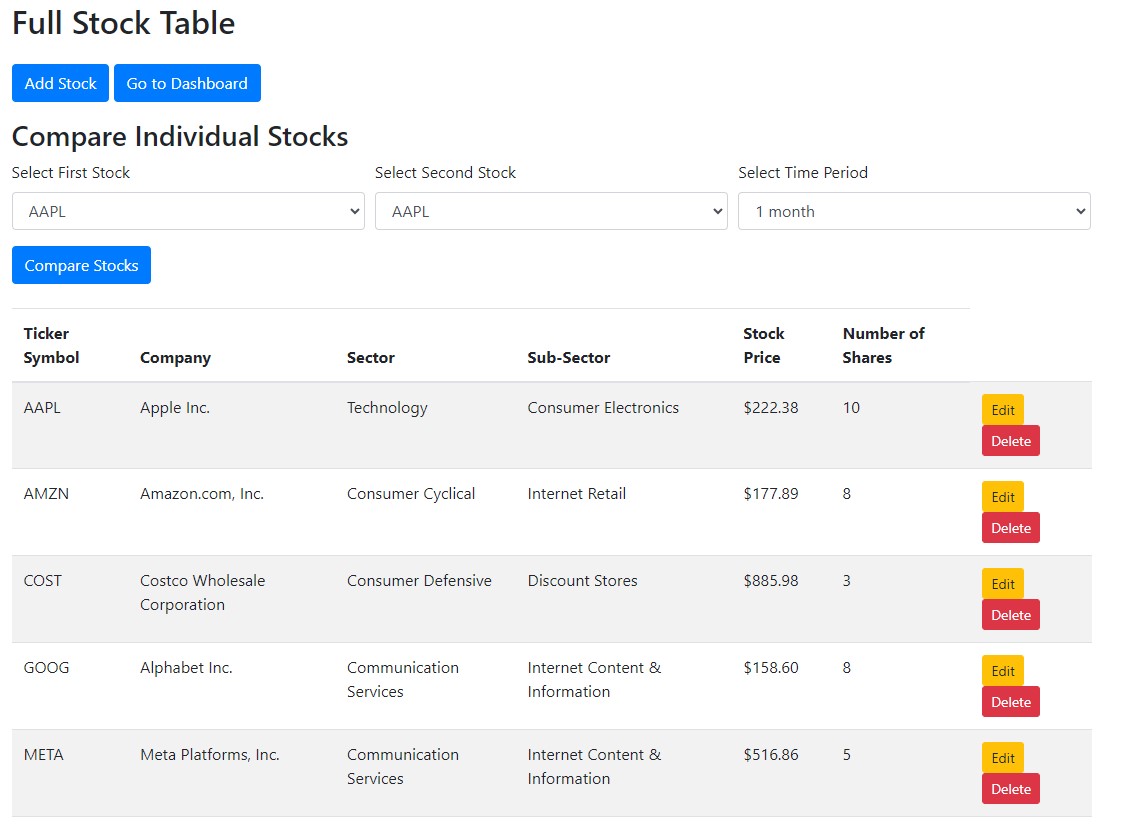
Compare Individual Stocks
The "Compare Individual Stock" feature allows users to select two of their stock symbols and choose a specific time period to analyze their performance. Users can compare the stock prices, stock prices with dividends included, and stock prices with dividend reinvestment. This feature provides a comprehensive view of how the selected stocks have performed over time, helping users make informed decisions based on both capital appreciation and dividend returns.
Key Features
- Manage and visualize your stock portfolio
- Compare performance of your portfolio over the market index over different periods
- Generate insightful charts and reports
Getting Started
Get Started
Ready to start? Sign up or log in to begin managing your portfolios and analyzing your stocks.
Register Log InContact and Support
If you have any questions or need assistance, please reach out to us at support@stockassembler.com.
Detailed Instructions
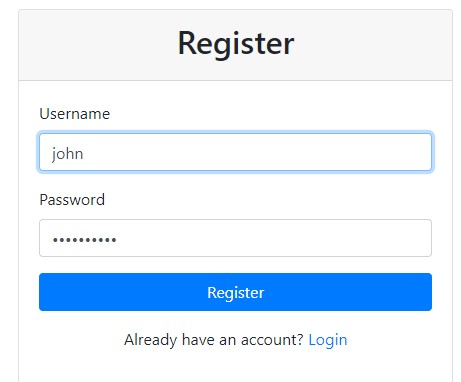
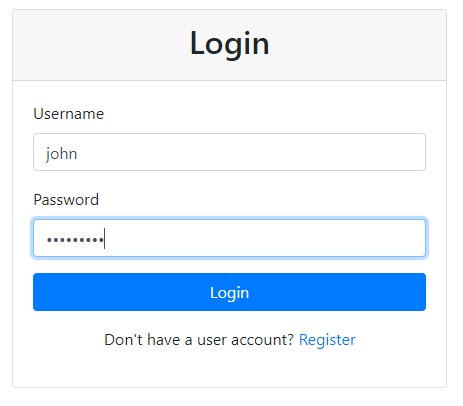
Step 1: Sign Up and Log In
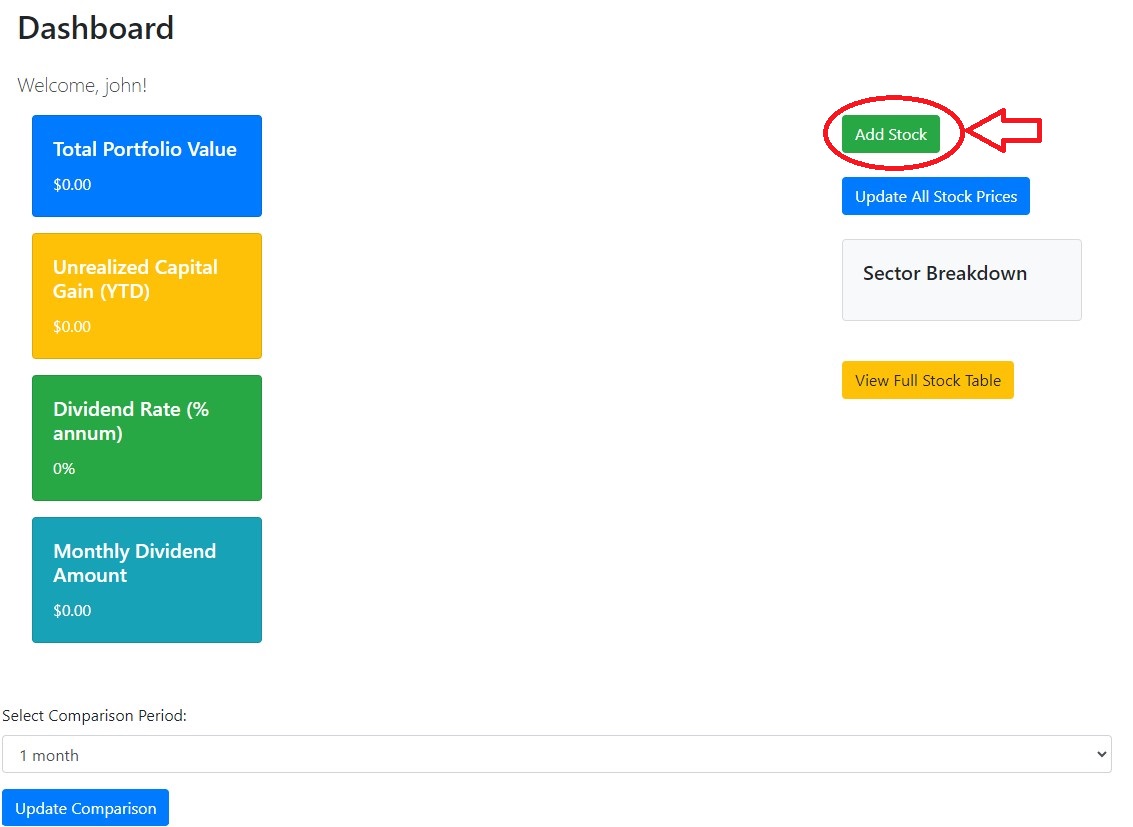
Create your StockAssembler account by clicking on the Register button. Choose your user ID and password. Once registered, you can log in using your credentials. After logging in, you'll be redirected to your dashboard where you can begin managing your portfolio. Initially, the dashboard will display as empty, awaiting your stock data. To populate it, proceed to Step 2 where you'll learn how to add stocks to your portfolio.
Step 2: Add Stocks to Your Portfolio
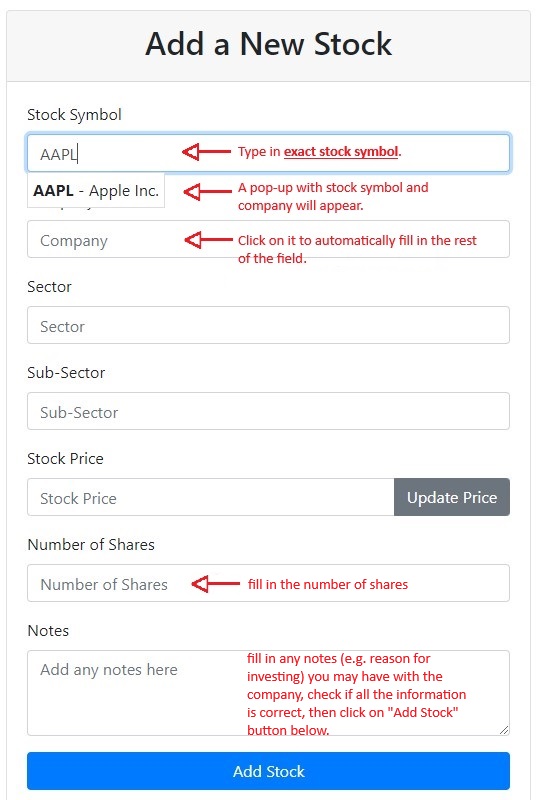
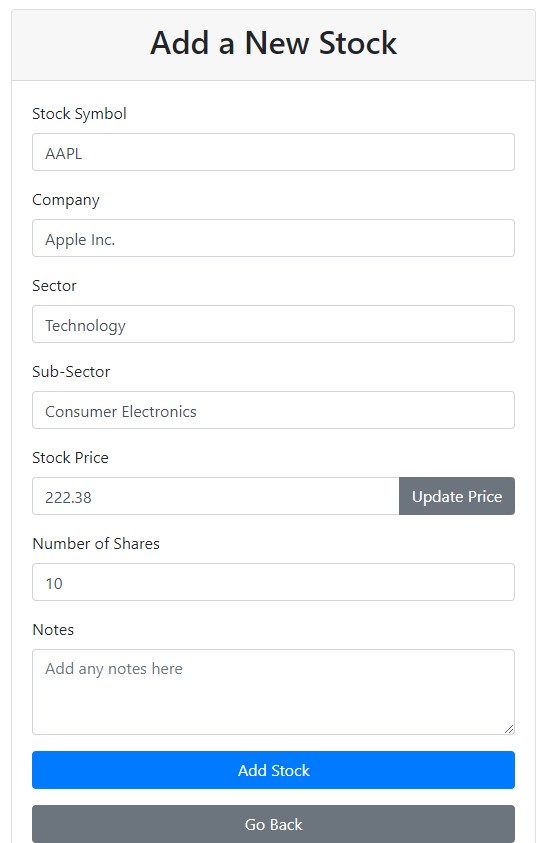
Go to the Add Stock page to enter details about the stocks you own. Start by entering the stock symbol (e.g., AAPL). As you type, a pop-up will display the ticker symbol and company name. Select it to automatically fill in other fields such as the company name, sector, sub-sector, and stock price. If your stock does not appear, it means your ticker symbol may be incomplete. Please refer to Yahoo Finance to find and enter the correct ticker symbols. You will need to manually enter the number of shares (a non-zero value) and any notes. Repeat this process for each stock you own. Once added, your portfolio will begin to populate, showing real-time performance data.
Step 3: Explore the Dashboard
The dashboard offers a comprehensive view of your portfolio, featuring visual insights into sector distributions, sub-sectors, and their relative weightings. You can interact with the chart to explore detailed allocations for each sector or sub-sector. For a complete list of stocks, or to edit or remove any stock, refer to Step 4.
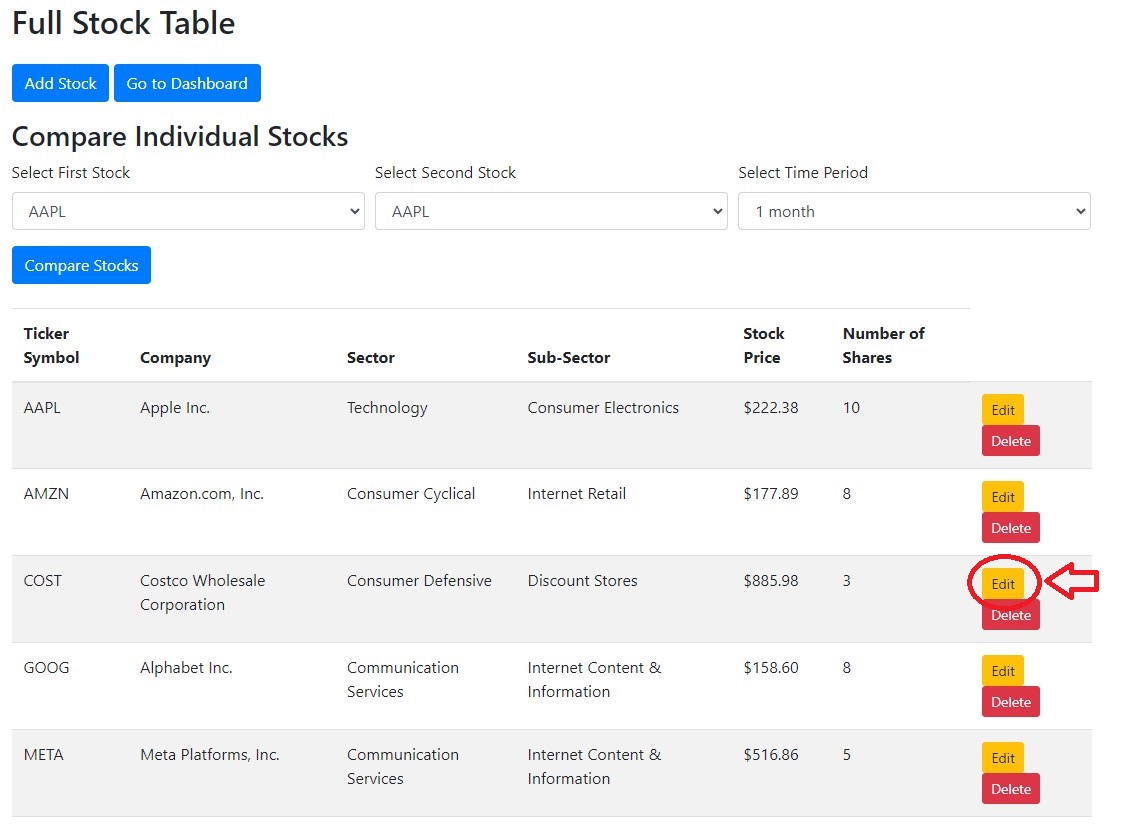
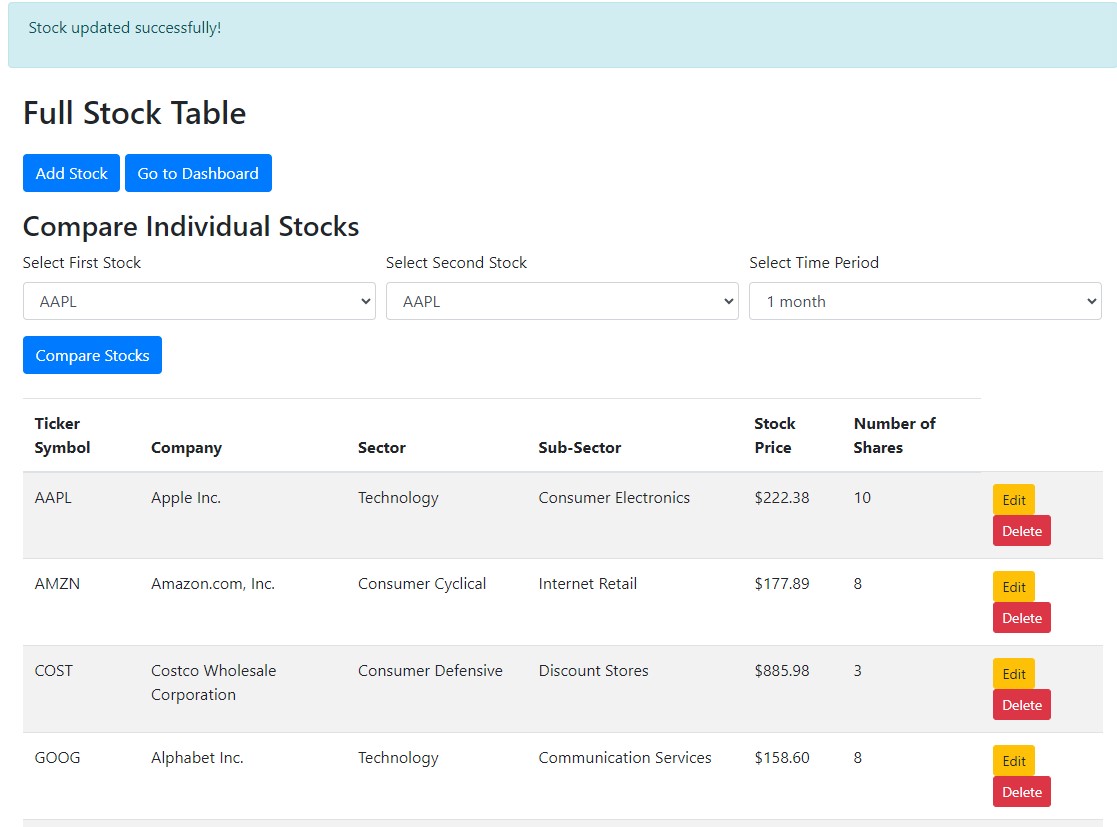
Step 4: Explore the Stock Table
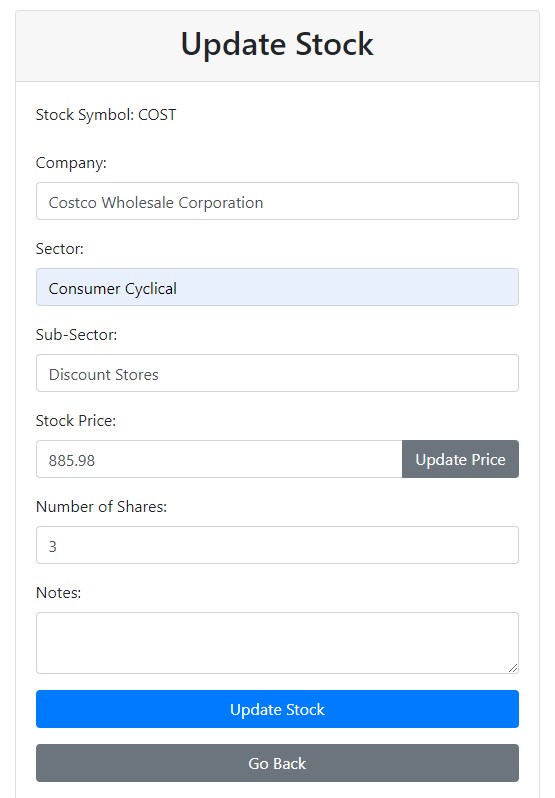
To access the stock table, click on View Full Stock Table. This will open a new page displaying a comprehensive list of all your stocks. On this page, you can edit individual stock details. For example, if you want to update the sector for Costco (COST), click the edit button next to Costco. An "Update Stock" panel will appear, similar to the "Add Stock" panel, allowing you to modify the stock's information, such as its sector. After reviewing the changes, click "Update Stock" to save your updates. The stock information will be updated in your stock table, and you can return to the dashboard to see the revised details.