austin
2026-10-30
Is AI Spending Too Much? What Alphabet and Microsoft's Filings Can and Can't Say
- Alphabet's capex rose from $32.3B in FY2023 to $91.4B in FY2025, and Microsoft's reached $115.9B in FY2026.
- Over five years, NVDA returned 746.1% with dividends reinvested, GOOGL 121.6%, QQQ 93.6% and MSFT 66.9%.
- Van Nieuwerburgh (Brookings) projects the AI build-out at about 3.6% of US GDP a year, 2025-2032, against about 2.2% for railroads in their peak two decades. That is a projection, not current spending.
- On current spending, history does not yet say "too much". The test is whether revenue growth follows the capex line.
Microsoft spent $28.1B on property and equipment in its fiscal 2023. Three years later it spent $115.9B. Alphabet's went from $32.3B in FY2023 to $91.4B in FY2025.
My thesis is narrow. The filings show the spending is accelerating fast. They do not show whether it will pay back, and a stock chart doesn't answer that either. So I'll lay out what the companies spent, how the shares have done over five years, and what to watch if you own them directly or through an index fund.
The spending is real, and it is steep
Capital expenditure here means the cash a company pays for property, plant and equipment, taken from SEC filings. For these companies that includes data centers and the hardware inside them. It isn't purely AI, but the direction is hard to miss.
Alphabet's fiscal year ends in December and Microsoft's in June, so read each column as that company's own fiscal year.
| Fiscal year | Alphabet capex | Microsoft capex |
|---|---|---|
| FY2023 | $32,251,000,000 | $28,107,000,000 |
| FY2024 | $52,535,000,000 | $44,477,000,000 |
| FY2025 | $91,447,000,000 | $64,551,000,000 |
| FY2026 | Not yet reported in my data | $115,948,000,000 |
Source: SEC EDGAR filings, PaymentsToAcquirePropertyPlantAndEquipment. Both companies raised the figure every year in the table.
A projection is not today's bill
To judge "too much", put spending next to the size of the economy and compare it with earlier build-outs.
The main source is Stijn Van Nieuwerburgh, "Financing the AI Build-Out," Brookings Papers on Economic Activity, Fall 2026. He puts the AI build-out at a projected requirement of about 3.6% of US GDP per year over 2025-2032, or $10.3 trillion in total. Railroads averaged about 2.2% of GDP over their peak twenty years, 1870-1890, with some peak years above 4%, and that figure leaves out rolling stock, so it may be a little low. Highways came in at about 1.1% of GDP in the 1950s, telecom and fiber in the internet boom at about 1.1%, canals at about 0.66% and electrification at about 0.5%. By his reading, the AI estimate is about 50% larger than the largest prior boom, railroads, and more than three times the internet boom.
Read the 3.6% carefully. It is a projected requirement for the whole build-out, not what companies spend now. Paul Kedrosky's published chart gives a current-spending estimate: datacenter capex at about 1.2% of GDP today, a telecom peak of about 1%, and a railroad peak of about 6% on a peak-year basis. The two sets measure different things. One is a projection and the other is today, and one is an average while the other is a peak year. Don't set them side by side as like for like.
Two more reference points. The FHWA's own Interstate history puts the final Interstate cost estimate at $128.9B. Reports on 1996-2001 telecom investment put it above $500B, with about 80 million miles of fiber laid.
Five years of returns tell a split story
All four tickers below are US-listed and priced in USD, over the same five years, October 29, 2021 to October 28, 2026.
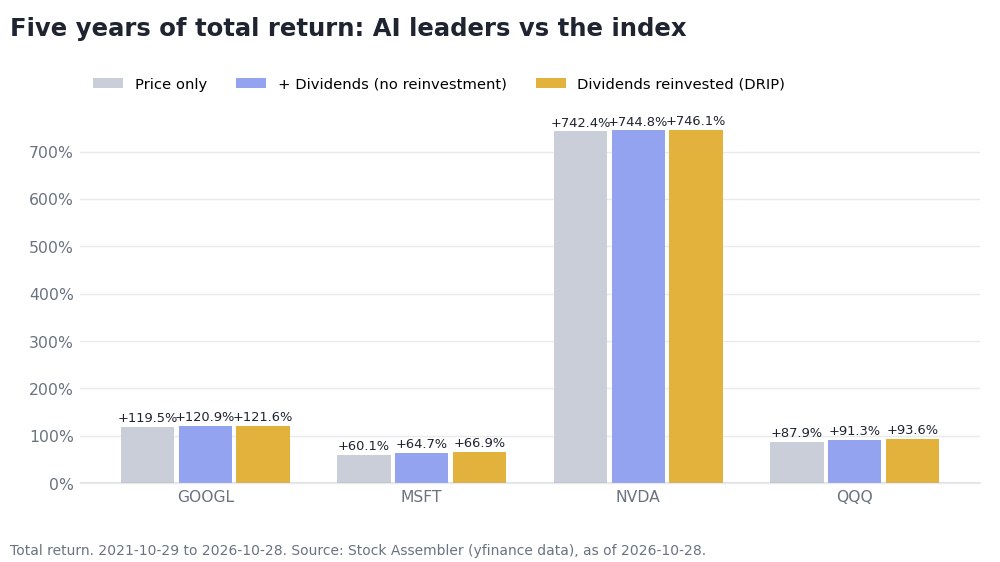
Total return for GOOGL, MSFT, NVDA and QQQ in three modes: price only, dividends without reinvestment, and dividends reinvested. October 29, 2021 to October 28, 2026. Data: Stock Assembler (yfinance).
NVDA is in a class of its own: 742.4% on price alone and 746.1% with distributions reinvested. GOOGL returned 119.5% on price and 121.6% reinvested. QQQ, the Nasdaq 100 fund I use as the benchmark, returned 87.9% on price and 93.6% reinvested.
Microsoft is the interesting one. At 60.1% on price and 66.9% reinvested, it trailed the index, while GOOGL beat it. I'm not connecting either result to spending, because a capex line and a share price have no clean cause-and-effect link.
The ride was rough too. The worst peak-to-trough price drop was 66.4% for NVDA, 44.3% for GOOGL, 37.6% for MSFT and 35.6% for QQQ. Past results say nothing certain about what comes next.
The strongest case for "it's fine"
The bull case assumes the companies can fund this from operations and that demand for AI services keeps growing. If demand holds, the data centers earn their keep, and spending that rises every year is also consistent with a company that sees more demand than it can serve.
The counter is that capex is a commitment made before the revenue shows up, and shareholders carry that risk first. I think the right stance is neither panic nor dismissal.
Verdict: not yet too much, but the test is coming
On current spending, the AI build-out sits above the telecom peak but well below the railroad peak, so history does not yet say "too much". On the Brookings projected path it would exceed all prior booms. That is why the test is whether revenue growth follows the capex line in coming filings.
What to check in your own portfolio
Open the holdings of each fund you own and look for GOOGL, MSFT and NVDA. Then ask whether you also hold them directly. Next, read each company's next filing for the capex line and see whether it keeps rising and whether revenue follows.
You can compare any tickers over the same window with Compare GOOGL vs MSFT on Stock Assembler.
This post is for informational purposes only and does not constitute financial advice. Return figures from Stock Assembler's Compare Tickers tool (yfinance data), October 29, 2021 to October 28, 2026. Capex figures from SEC EDGAR filings. Past performance does not guarantee future results.