austin
2026-10-07
QYLD Paid 11.4% a Year and Still Lost to QQQ by 61 Percentage Points
- QYLD yields 11.4% on a trailing 12-month basis, yet over five years its price fell 16.6% while QQQ's rose 109.3%.
- With distributions reinvested, QQQ returned 115.6% and QYLD returned 54.6%, a 61 percentage point gap.
- QYLD's income is largely the Nasdaq index upside it sold away, paid back to you as distributions.
- The cap has a real use, but a bull market is the worst time to pay for it.
QYLD's price is lower today than it was five years ago. Its owners still collected a distribution every month, and that is exactly why so many people never notice what the fund costs them.
The yield is the upside, paid out early
My argument is simple. In a strong bull market for growth stocks, a covered-call fund does not create extra income. It takes gains the Nasdaq index would have handed you anyway and converts part of them into a distribution, while capping the rest.
Here is the mechanic. QYLD holds the index QQQ tracks and sells call options against it. The premium from those options funds the monthly payout. In return, QYLD gives up the gains above the strike price. When the index rallies hard, the buyer of the option keeps that rally. When the index falls, QYLD keeps the premium but still owns the falling stocks.
QQQ holds the same index with no options overlay. That makes it the cleanest possible control for what the overlay does.
Five years, same index, very different outcomes
The data runs from October 7, 2021 to October 6, 2026. Start with price only, which strips out every distribution. QQQ's price rose 109.3%. QYLD's price fell 16.6%. That is a gap of 125.9 percentage points before a single dividend is counted.
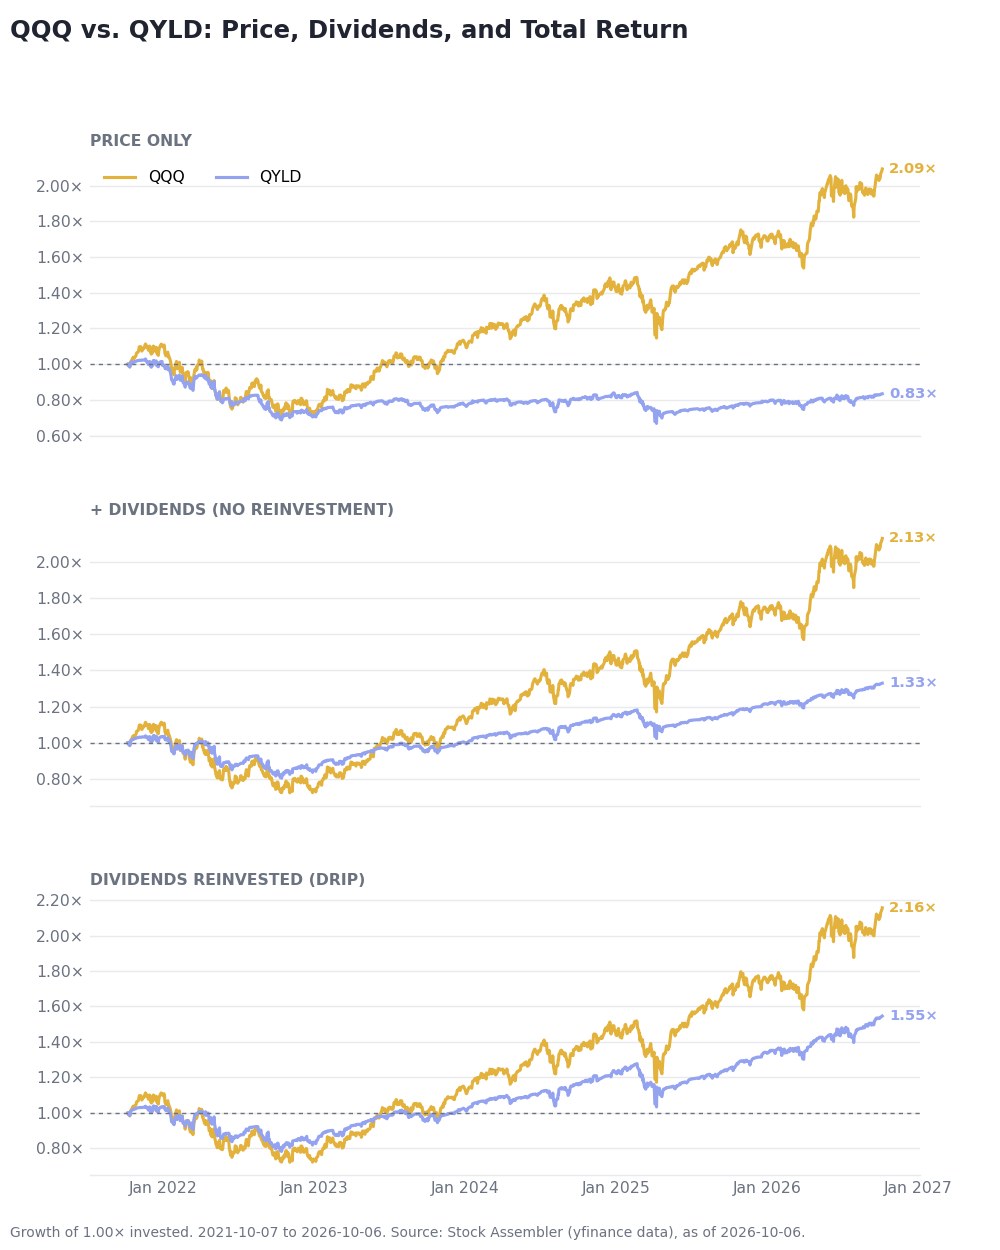
Price only, dividends paid out without reinvestment, and dividends reinvested, October 7, 2021 to October 6, 2026. Data: Stock Assembler (yfinance).
The top panel is the price-only story. The middle panel shows the distributions each fund paid out, without reinvesting them, which is the bridge between price and total return. The bottom panel is the one most income investors care about, with distributions reinvested. QQQ returned 115.6%. QYLD returned 54.6%. The distributions rescued QYLD from a loss, but they left it 61 percentage points behind.
The headline yield tells a similar story from the other side. QYLD's trailing 12-month yield is 11.4%, paid across 12 distributions. QQQ's is 0.4%, paid across 4. On a yield screen, QYLD looks like the winner by a mile. On total return, it is not close.
Where the price chart does the damage
The second chart isolates price. It shows a pattern I think matters more than the final numbers.
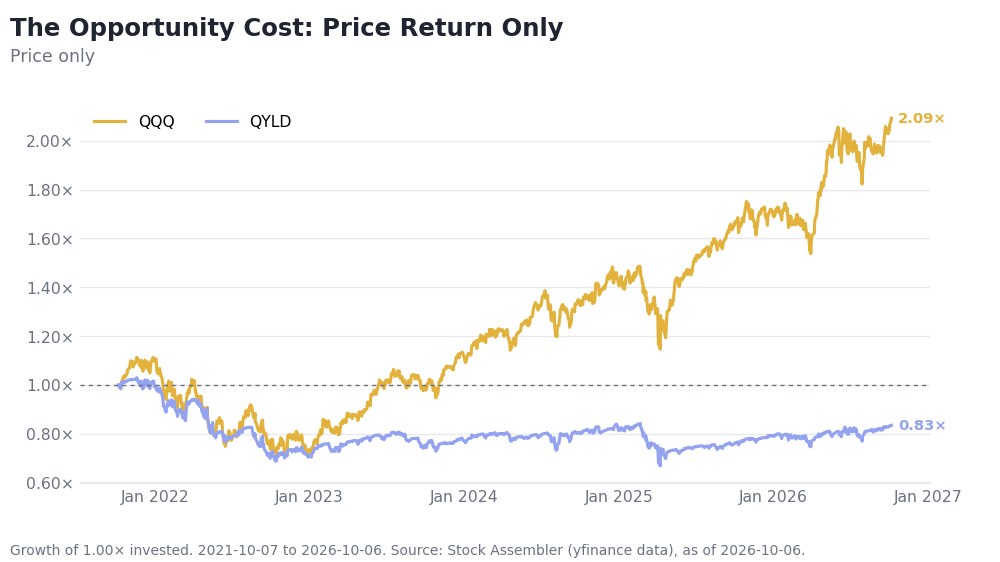
Price-only growth of an investment, QQQ vs. QYLD, October 7, 2021 to October 6, 2026. Data: Stock Assembler (yfinance).
Both funds fell together through the 2022 drawdown. After that, they separated. QQQ climbed through the later rally and QYLD mostly drifted sideways, ending below where it started. Every time the index surged, the option overlay took a share of the move. Every time it dropped, QYLD still took the hit. That asymmetry is the cost of the strategy, and it compounds.
This is also why a price chart for a high-yield fund deserves suspicion. A price that fails to grow while the payout stays high means part of what you receive each month is your own capital coming back to you, not new wealth arriving.
The fair case for QYLD
I do not think QYLD is a bad product. Reinvested, it still returned 54.6% over the period, which is a respectable result by most standards. The reinvested panel in the first chart also shows QYLD holding up better than QQQ through the 2022 slide, and the monthly cash flow can matter to someone who is drawing income from a portfolio and cannot tolerate selling shares in a drawdown.
That is the honest trade. You buy a smoother ride and a regular paycheck, and you pay for it with the upside in years like these. The mistake is believing the paycheck is free. It was funded by the gains you did not keep.
One caveat on my own argument: this is one five-year window dominated by a strong run in growth stocks. In a flat or choppy market the premium income would look much better against QQQ. The thesis here is about bull markets, and I would not stretch it beyond that.
What I would check before buying a high-yield fund
Before you buy any covered-call fund, put its yield aside and ask what you would have earned holding the plain index over the same period. If the gap in total return is large, you are paying a lot for the income stream. Then check price-only performance. If the price has gone nowhere or down while the yield stays high, treat the distribution as partly your own money returned.
Last, decide what the money is for. If you need cash flow and can accept lagging the index, the trade can be reasonable. If you are still building wealth over a long horizon, the data above argues for owning the index itself.
You can run this comparison on any pair of funds in Stock Assembler's Compare Tickers tool.
This post is for informational purposes only and does not constitute financial advice. Return figures from Stock Assembler's Compare Tickers tool (yfinance data), October 7, 2021 to October 6, 2026. Past performance does not guarantee future results.