austin
2026-06-12
You Don't Have to Choose Between Income and Growth
Yes, QQQ outperformed both on price. That is what covered call ETFs do — they trade some price upside for monthly income. But once you add distributions back in, QQQI and JEPQ delivered roughly 25 to 28% total return over the past 12 months while depositing regular monthly cash into investors' accounts. The question is not whether they matched QQQ. The question is whether 25 to 28% total return plus monthly income competes with your alternatives.
Against a bond ETF yielding 4.5% or a dividend stock yielding 3.8%, it does — and it is not close.
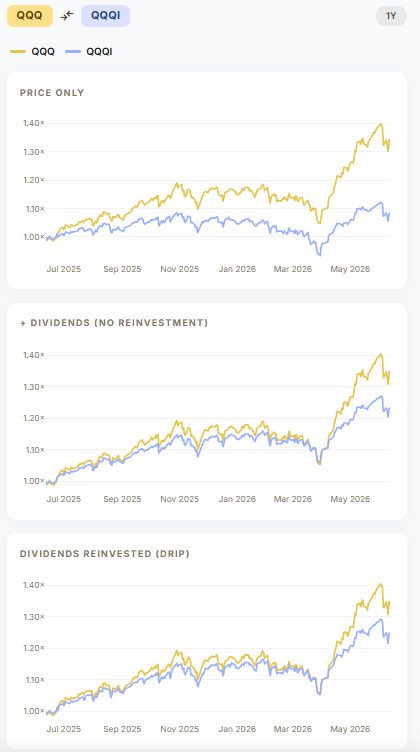
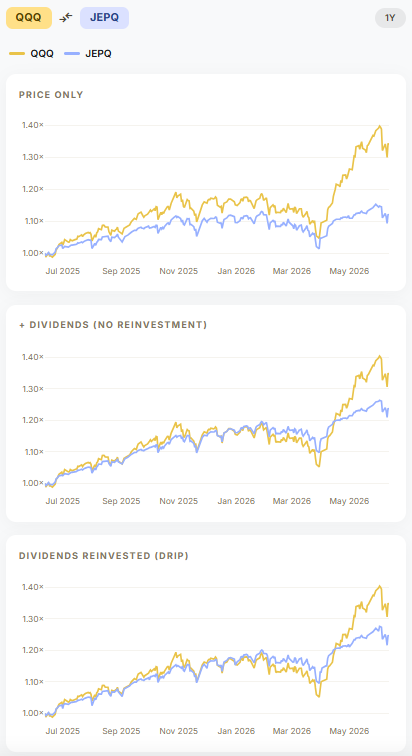
Why the Income Is Higher Right Now
A covered call ETF owns the underlying basket of stocks and sells call options against those holdings. The option premium collected from those sales becomes your monthly distribution. The size of that premium depends directly on implied volatility.
The VIX has been elevated and trending higher through mid-2026. Geopolitical uncertainty, rate anxiety, and macro data prints have kept markets on edge. For most investors that reads as risk. For QQQI and JEPQ holders, elevated volatility means the options being sold are worth more, which means larger distributions. The fear in the market is the income. That dynamic is working in favour of covered call holders right now, not against them.
What a Real Portfolio Looks Like
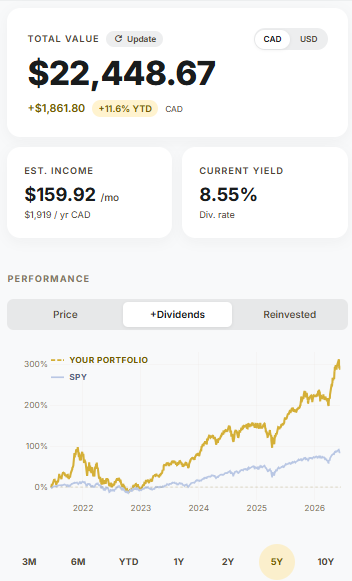
The allocation shown here pairs approximately 75% in covered call ETFs — QQQI, JEPQ, and a covered call QQQ strategy — with roughly 25% in direct technology holdings in NVDA and AMD. Total portfolio value is $22,448.67 CAD. Current yield is 8.55% annually. That translates to $159.92 per month in estimated income, or $1,919 per year.
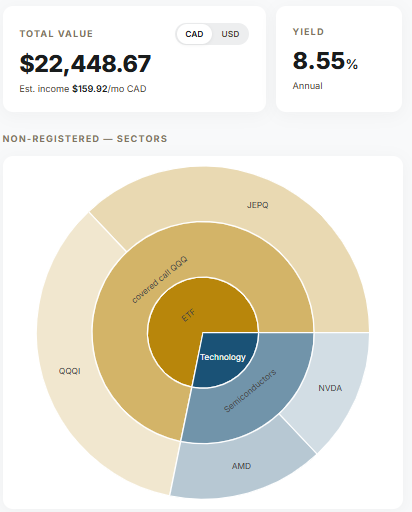
The income core handles the monthly cash flow. The NVDA and AMD positions preserve direct exposure to the growth phase that covered calls would otherwise cap. Neither sleeve is trying to do the other's job.
Run the same structure back over five years and the total return picture including distributions significantly outpaces SPY. The monthly income compounds in a way that pure price return comparisons never capture.
The Risk Worth Naming
QQQI, JEPQ, NVDA, and AMD all live in the same sector. In a sharp Nasdaq correction, the income core and the growth satellite move down together. The portfolio is not diversified against a technology sector selloff. It is optimised for a volatile but broadly resilient tech environment, which has been the actual environment for most of the past five years.
Investors who want the income core to genuinely anchor against something should consider pairing this structure with uncorrelated income sources. Canadian pipelines, consumer staples dividend growers, or industrial REITs behave differently than technology in a sector rotation. The blended idea is sound. Doubling tech risk across two allocation lines is the version of this that breaks down.
The Actual Choice
Most income investors are not choosing between QQQI and QQQ. They are choosing between QQQI and bonds, or between QQQI and a 3 to 4% dividend stock. Framed that way, a covered call strategy generating 8.55% annual income plus meaningful price participation is a different conversation than the yield trap debate suggests.
The past year's data is in the charts. Whether the next 12 months look similar depends on whether this volatility regime continues. Given the current macro backdrop, that is a reasonable working assumption — not a guarantee.
This post is for informational purposes only and does not constitute financial advice. Portfolio data sourced from StockAssembler as at June 2026. Past performance does not guarantee future results.