austin
2026-05-02
The Market Is Panicking. Your Covered Call ETF Is Quietly Getting Paid. Or Is It?
Most investors see high volatility in the stock market and a barrel of Brent crude at $108 and they want out. That reaction is understandable, and it may be exactly backwards if you hold covered call ETFs.
The same volatility scaring retail investors out of their positions is the fuel that drives covered call distribution income. Right now, in this specific macro moment, those mechanics are working in your favour. But whether that's true for your covered call ETF specifically is a different question, and the one worth asking.
What's Driving Volatility Right Now
Three things are stacking simultaneously, and each one contributes to option premiums staying elevated.
Energy. Ongoing geopolitical conflict around the Strait of Hormuz, combined with the UAE formally exiting OPEC+, has introduced supply-side uncertainty pushing Brent crude to $100–$108 per barrel which is roughly 65% above pre-war levels. That's not a blip; it's a structural repricing that bleeds into commodity volatility across the board.
Monetary policy. The Fed is holding at 3.5–3.75%, CPI is running at 3.3% (March 2026), and the probability of any 2026 rate cut has dropped substantially. A Fed holding the rate indefinitely keeps traders guessing, and a persistent inflationary environment tends to keep implied volatility on equity options elevated.
Earnings season. The week of April 28 carried GOOGL, MSFT, AMZN, META, and AAPL. Results were broadly solid, but heavy AI capital expenditure commitments have left investors uncertain about near-term earnings trajectories, adding another layer of uncertainty that option premiums reflect.
Why Flat and Volatile Is the Sweet Spot for Covered Call ETFs
Covered call ETFs generate income by selling call options on their underlying holdings. The premium collected from those sales funds the monthly distribution you receive. Option premiums are priced on implied volatility. When markets are choppy and uncertain, as they have been throughout 2026, implied volatility stays elevated and the premiums the fund collects stay elevated with it.
A sideways, anxious market isn't a dead zone for covered call holders. It's close to ideal conditions.
The Numbers Make the Case
Take GDV.TO against VT year-to-date through May 1, 2026. The price action tells a nearly identical story — both essentially flat, both absorbing the same macro turbulence. But once you include distributions, GDV.TO's total return separates meaningfully. The underlying didn't need to go anywhere. The income did the work.
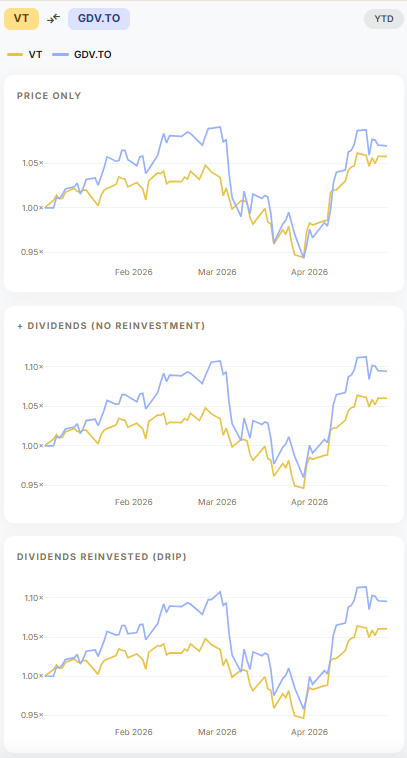
This is the environment that covered call ETFs were designed for. Not a ripping bull market. They'll lag in that scenario. A grinding, uncertain one, where capital gains are scarce and monthly income compounds quietly in the background.
Not All Covered Call ETFs Are Built the Same
Here's where the category label starts to mislead. Two funds can both be called covered call ETFs, both yield around 9%, and produce very different outcomes depending on how they're constructed.
The April 2026 market move illustrates this cleanly. When the S&P 500 posted a sharp upside move in the final week of the month, XYLD captured only a fraction of it. The short calls the fund had written capped its participation at precisely the moment the index moved. Holders collected their premium income, and watched the underlying run past them.
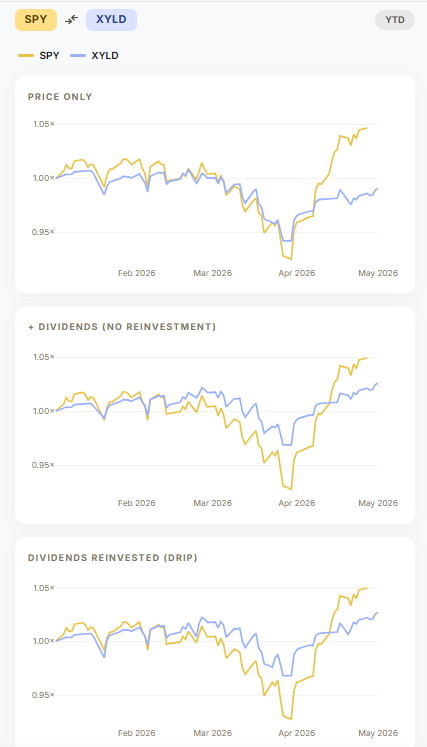
That's not a malfunction. It's the structure doing exactly what it's designed to do. But it illustrates the core tension every covered call investor needs to sit with: you are permanently trading away the upper tail of your return distribution. In a sustained rally, that cost compounds.
The Right Way to Evaluate a Covered Call ETF
Compare the long-term total return (e.g., price plus distributions, potentially with distributions reinvested) of a covered call ETF against its underlying index over at least two years. That comparison tells you what every investor should care about most: what you actually made. It shows how much upside was sacrificed, whether distributions compensated for that sacrifice, and whether the fund delivered through a full market cycle.
The difference between funds tracking the same underlying can be striking. QQQ versus QYLD versus QQQY.TO (all nominally Nasdaq-100 covered call strategies) tell three meaningfully different stories.
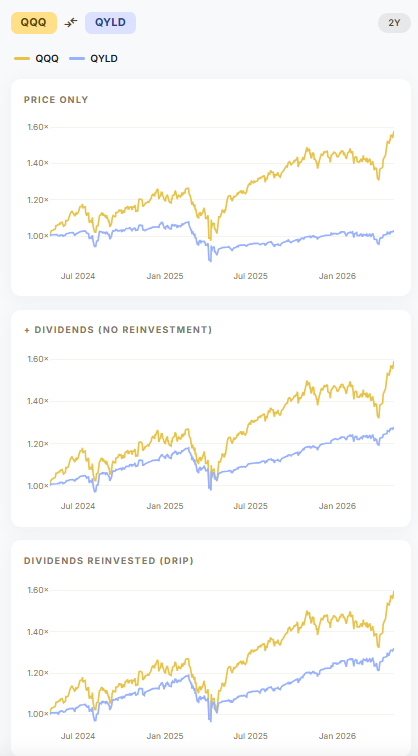
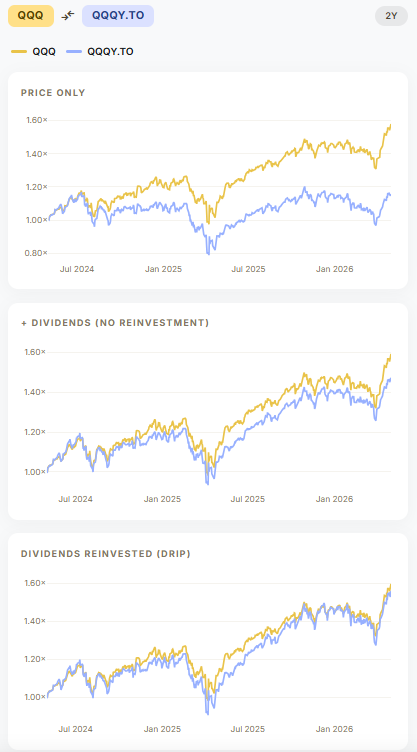
Same underlying. Same category label. Very different outcomes. Over the past two years, QYLD holders have substantially sacrificed the upside that Nasdaq-100 holders enjoyed. QQQY holders, by contrast, have captured most of that upside through a combination of price return and distributions. Whether QQQY can sustain that performance over the next market cycle remains to be seen.
Rather than pulling data from multiple sources and stitching it together manually, I used StockAssembler comparison tool to run these total return comparisons directly. Comparing a covered call ETF's total return against its underlying index is the most honest, intuitive way to evaluate whether a particular fund is worth holding long term.
This post is for informational purposes only and does not constitute financial advice. Always do your own research before making investment decisions.