austin
2026-10-19
Earnings Week and Covered Call ETFs: What QQQI and JEPQ Give Up for the Income
- Since January 30, 2024, QQQI's price rose just 7.6% and JEPQ's 13.2%, while QQQ's rose 66.9%.
- With distributions reinvested, QQQI returned 57.3% and JEPQ 53.0%, against 69.3% for QQQ.
- Drawdowns were close: QQQI fell 20.0% at worst, JEPQ 20.1%, QQQ 22.8%. The premium cushions a drop, it doesn't prevent one.
- Earnings week compresses that trade-off into a few days: the option structure caps a gap up and only slightly cushions a gap down.
Every earnings season, a few giant Nasdaq names report within days of each other. If you own a covered call fund that yields double digits, you might assume that income cushions the blow. It does, but less than the yield suggests.
My view: QQQI and JEPQ are built so that a big upward gap is only partly captured, while a big downward gap is only slightly cushioned. Earnings week doesn't change that design. It just compresses it into a few days.
The call sits on the index, so the cap sits on the index
These funds hold Nasdaq-100 exposure and sell call options on it, taking a premium now in exchange for giving up gains above a strike price. Gains above the strike go to the option buyer, so a big gap up in the index is partly given away.
On the way down there is no matching floor. The premium collected is a small buffer, and once the index falls through it, the fund is losing money like any other long equity position. That asymmetry is the whole product. You are paid monthly to accept it.
What the price chart shows
The comparison below starts on January 30, 2024, because that is when QQQI's data begins, and runs to October 16, 2026. That is the window, not the five years the tool defaults to. JEPQ has a longer history, but I've trimmed it to match so the three lines share a start date.
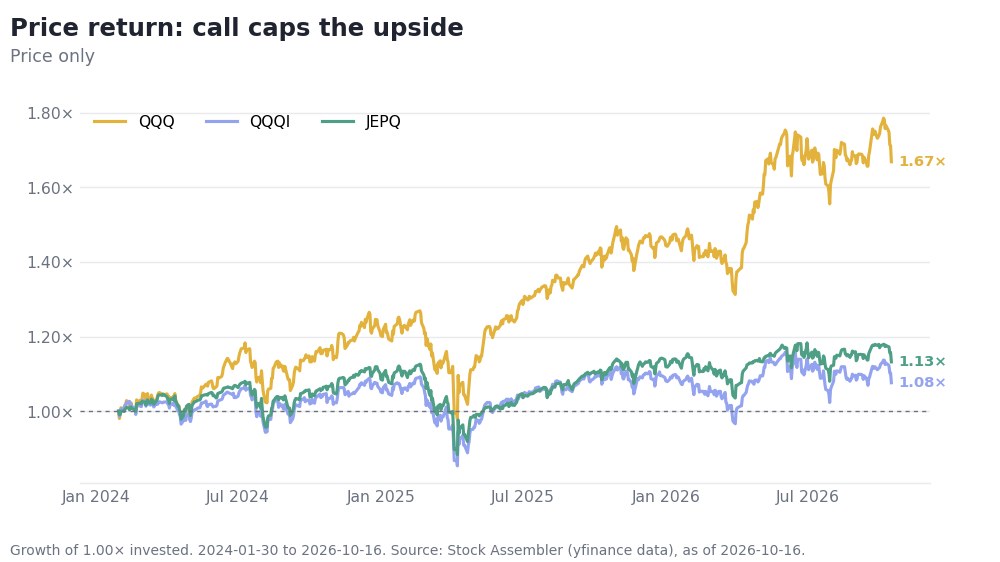
Price return only (no distributions), January 30, 2024 to October 16, 2026, QQQ vs QQQI vs JEPQ. Data: Stock Assembler (yfinance).
Price only, QQQ gained 66.9%. QQQI gained 7.6% and JEPQ gained 13.2%. Look at the stretches where QQQ climbs steeply: the two funds barely follow. Look at the spring 2025 selloff: all three fall sharply. That is the capped upside and the exposed downside in one picture.
But price return is the wrong yardstick for an income fund. These funds pay out most of what they earn, so the price line is supposed to lag.
Add the distributions back and the gap narrows
QQQI's trailing 12-month yield is 14.3%, paid monthly, and its trailing distributions came to $7.642 per share. JEPQ's yield is 11.7%, also monthly, at $6.886 per share. QQQ yields 0.4% and pays quarterly, $3.091 per share over the same window.
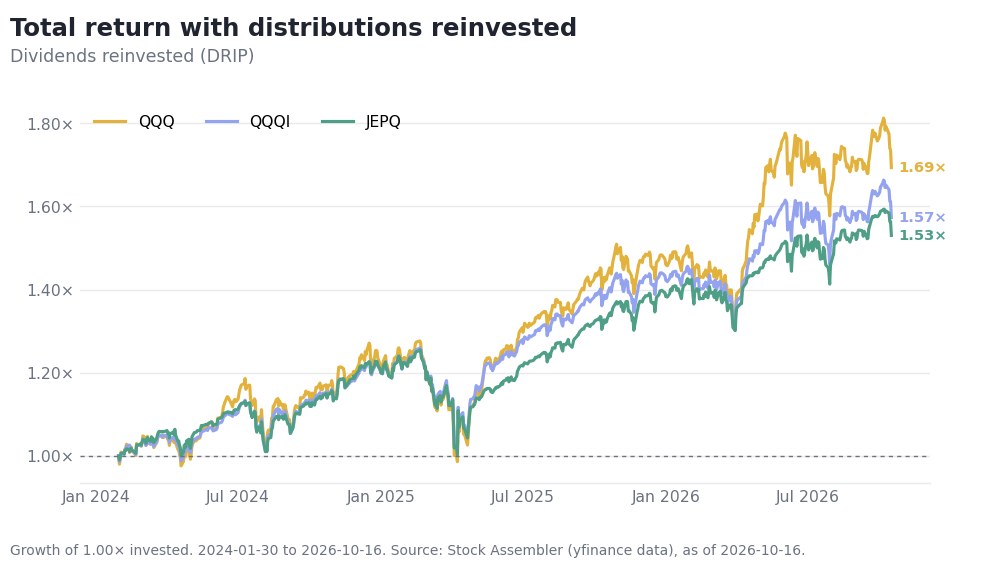
Total return with distributions reinvested, January 30, 2024 to October 16, 2026, QQQ vs QQQI vs JEPQ. Data: Stock Assembler (yfinance).
Reinvested, QQQI returned 57.3% and JEPQ returned 53.0%, against 69.3% for QQQ. The income closes a large part of the price gap, and QQQI finished ahead of JEPQ over this window. QQQ still won, though, in a period dominated by a strong Nasdaq rally.
I'd stress the word reinvested. If you spend the distributions, you are on the price line plus cash in hand, and the picture is closer to the first chart.
The fair case for the covered call funds
The strongest argument for these funds is the drawdown. QQQI's worst peak-to-trough fall with distributions reinvested was 20.0%, and JEPQ's was 20.1%. QQQ's was 22.8%. The premium does soften a fall, and for someone drawing income from a portfolio, a smoother ride and monthly cash have real value.
The honest limit is that the cushion is small. A fall of roughly one fifth is not a defensive result. If you bought these funds believing the option income made them a shelter, the data over this window says otherwise.
There's also a sample-size caveat. This is a window of the window that happened to include a sharp drawdown and a strong recovery. A different window, with a long sideways market, could favour the income funds more.
What to check before the next report
Before earnings week, ask what job the fund does in your portfolio. If it is income, judge it on total return with distributions reinvested, and compare that to the plain index fund, not to a savings rate. If it is meant to protect capital, look at its drawdown next to the index and decide whether a couple of points of cushion is worth the capped upside.
Then decide what you'd do with a big gap up that you only partly own. If the answer is that you would have wanted all of it, you may be holding the wrong tool for that slice of the portfolio.
You can run this comparison on any set of funds in Stock Assembler's Compare Tickers tool.
This post is for informational purposes only and does not constitute financial advice. Return figures from Stock Assembler's Compare Tickers tool (yfinance data), January 30, 2024 to October 16, 2026. Past performance does not guarantee future results.