austin
2026-10-19
NVDA Won Five Years. Energy Won the Last Twelve Months. Own Both by Rule.
- Over the past year, XLE returned 64.6% and CVX returned 54.1% with distributions reinvested, while NVDA returned 18.1%.
- Over five years the picture flips: NVDA returned 867.8%, XLE 183.3% and CVX 150.9%.
- A fixed-weight mix of NVDA, XLE and CVX returned 47.0% over the past year against 16.8% for SPY, with annualized volatility of 17.4%.
- One year is a narrow window. The case for holding both rests on fixed weights, not on predicting which one leads next.
Look at five years of NVDA and energy on one chart and the choice seems obvious. Look at the last twelve months and it seems obvious the other way. Both views are true, which is the whole problem.
My thesis is simple. Chips and energy are linked through AI's demand for power, but they pay off at different times, so an income-minded investor is better served by holding both at fixed weights than by picking a winner. The data supports that only in part, and I'll show you where it stops.
Five years say NVDA, and it isn't close
From October 18, 2021 to October 16, 2026, NVDA returned 867.8% with distributions reinvested, a 57.5% annualized rate. XLE, the broad energy sector fund, returned 183.3%. Chevron (CVX) returned 150.9%.
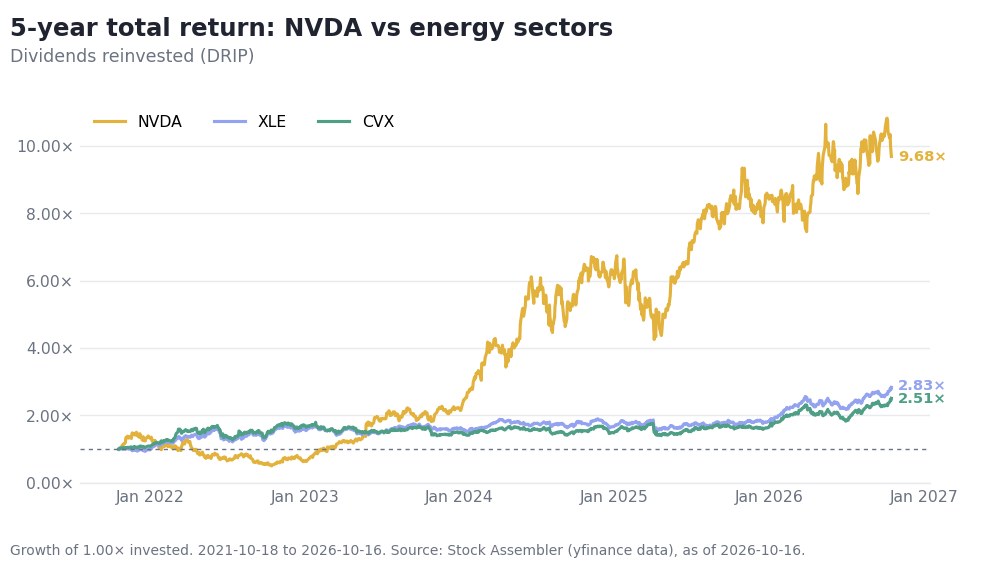
Growth of an equal starting investment, distributions reinvested, October 18, 2021 to October 16, 2026. Data: Stock Assembler (yfinance).
That is why investors chased chips and ignored energy. The chart also shows the cost. NVDA's annualized volatility over the period was 51.9%, and the line on the chart is jagged in a way the energy lines are not. Anyone who bought NVDA and held earned the return, but they had to sit through some brutal stretches to get it. Most people don't, and the return they actually capture is usually smaller than the one on the chart.
Then the last twelve months reversed the order
From October 16, 2025 to October 16, 2026, XLE returned 64.6% with distributions reinvested. CVX returned 54.1%. NVDA returned 18.1%. The leader of the five-year chart finished last of the three.
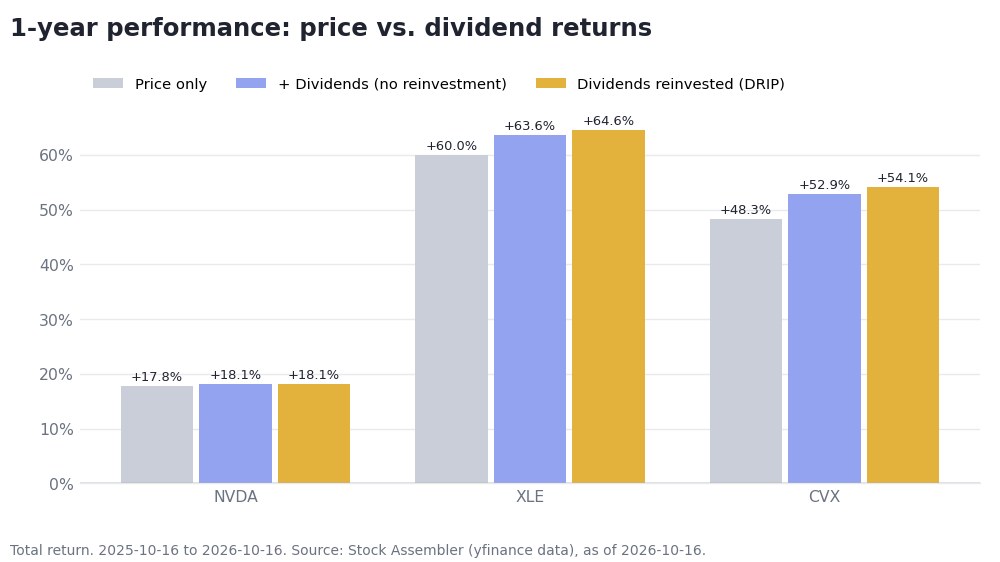
One-year return in three modes: price only, distributions without reinvestment, and distributions reinvested, October 16, 2025 to October 16, 2026. Data: Stock Assembler (yfinance).
The chart also shows how much of that gap is distributions. For NVDA, reinvesting adds almost nothing: 17.8% price only versus 18.1% with distributions reinvested. XLE carries a 2.2% trailing yield and CVX a 3.1% yield, and for both, the reinvested bar sits above the price-only bar. For energy, the income is a visible part of the return. For NVDA it barely registers.
One note on NVDA's payouts: the data flags two special distributions of $0.25 each, paid on June 4, 2026 and September 10, 2026. They are small and included in the figures above. Its regular distributions are quarterly, totaling $0.52 per share over the trailing twelve months, which is why it never works as an income holding on its own.
Fixed weights smooth the ride
Here is where the rule comes in. I tested one fixed-weight mix over the same twelve months, with NVDA as the smallest holding and the rest split evenly between XLE and CVX. It returned 47.0% with distributions reinvested, against 16.8% for SPY. Its blended trailing yield was 2.0%, and its annualized volatility was 17.4%.
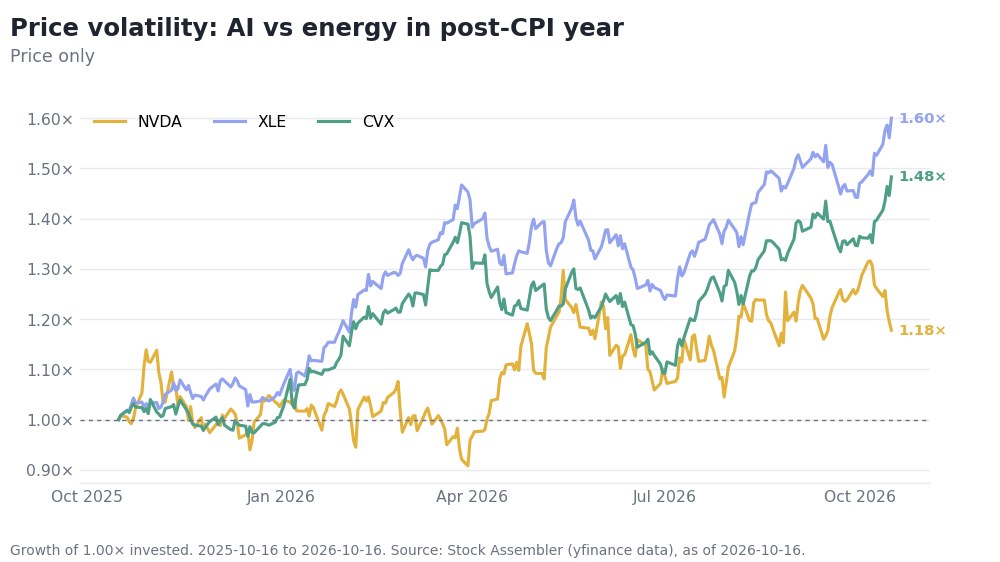
Price-only growth of an equal starting investment, NVDA, XLE and CVX, October 16, 2025 to October 16, 2026. Data: Stock Assembler (yfinance).
The price chart shows why the mix is calmer than NVDA alone. NVDA's one-year volatility was 37.3%, against 22.0% for XLE and 24.1% for CVX. The portfolio's 17.4% is lower than any of the three, which only happens when the holdings do not move in lockstep. The blend absorbs some of NVDA's swings because the energy names were often moving on different days, for different reasons.
You can run this comparison on any set of funds in Stock Assembler's Compare Tickers tool.
Where I'd push back on my own thesis
The 47.0% figure is a one-year result, and most of it comes from energy having a very strong year. It is not evidence that energy beats chips, and the five-year chart says otherwise. A portfolio built in 2021 with the same weights would have given up a large share of NVDA's run. I'm also describing a link between AI and power demand as a reasonable story, not something these numbers prove. The data shows the two groups led in different years. It does not show why.
So I would not sell the idea as a prediction that energy keeps winning. The case is narrower. If you can't tell which group leads next, fixed weights stop you from holding all of the volatility in a single name, and they force you to trim whatever just ran and add to whatever lagged.
What to check in your own portfolio
Write the rule down before you need it. Pick target weights, pick a review date, and decide in advance that you will trim the winner back to target on that date, whatever the headlines say. Without it, rebalancing becomes a mood.
Then check three things. First, what share of your portfolio's volatility comes from one holding. Second, how much of your return over the last year came from distributions versus price, using the reinvested and price-only figures side by side. Third, whether your weights today still match the ones you chose, because a strong run in one name quietly rewrites your allocation.
This post is for informational purposes only and does not constitute financial advice. Return figures from Stock Assembler's Compare Tickers and portfolio tools (yfinance data): five-year figures cover October 18, 2021 to October 16, 2026; one-year figures cover October 16, 2025 to October 16, 2026. Past performance does not guarantee future results.