austin
2026-10-12
Five Years of REITs: US Fund Barely Positive, Canadian Fund Still Underwater
- Over five years to October 9, 2026, VNQ, the US REIT fund, returned 5.4% with distributions reinvested, while Canada's XRE.TO lost 3.9%.
- On price alone the gap looks wider: VNQ fell 13.2% and XRE.TO fell 23.9%, each in its own currency.
- XRE.TO yields 4.7% in Canadian dollars against VNQ's 3.8% in US dollars, but that is not a clean spread, and the extra yield did not make up for the weaker price.
- The data shows the divergence. It does not show why, so treat rate-sensitivity stories as hypotheses.
A REIT investor who bought a broad US fund and a broad Canadian fund five years ago, and reinvested every distribution, would be looking at two very different outcomes today. One is slightly ahead. The other is still below where it started.
That split fits the popular story, which says US and Canadian REITs are drifting apart because of rate sensitivityThe popular story says US and Canadian REITs are drifting apart because of rate sensitivity and refinancing pressure. The return history does show a gap. What it can't show is the cause, and I'd rather say that plainly than dress up a guess as a finding.
Both funds went through the wringer, only one climbed out
I compared Vanguard Real Estate ETF (VNQ), which holds US REITs and trades in US dollars, with iShares S&P/TSX Capped REIT Index ETF (XRE.TO), which holds Canadian REITs and trades in Canadian dollars. The window runs from October 12, 2021 to October 9, 2026, a full five years.
Start with the pain. With distributions reinvested, VNQ's worst peak-to-trough fall was 34.5%. XRE.TO's was 30.5%. The Canadian fund was not the more fragile one in a crash, and its volatility was a little lower too, at 16.2% a year against 18.9% for VNQ.
The difference is in the recovery. VNQ climbed back to a 5.4% total return. XRE.TO ended at a loss of 3.9%.
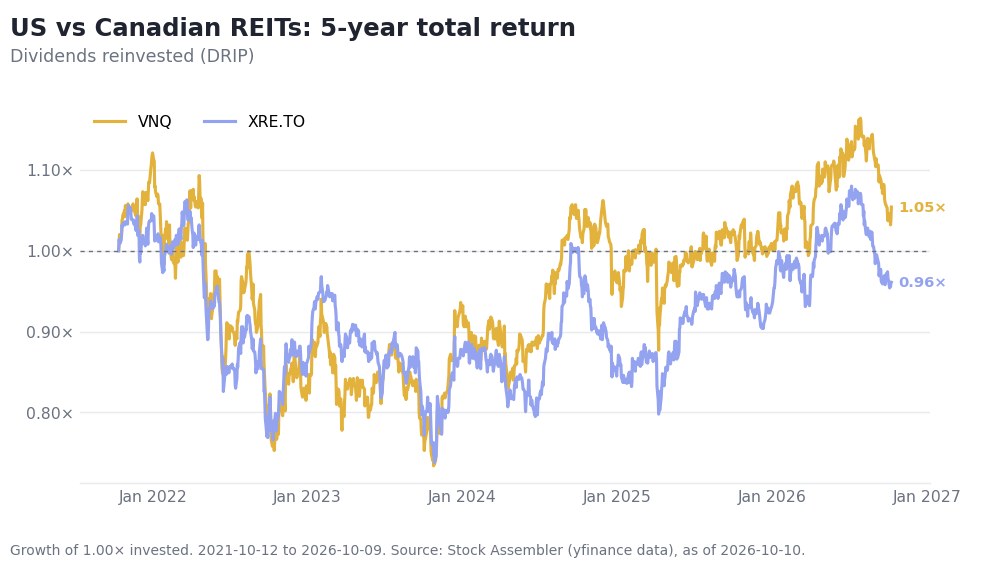
Growth of an initial investment in VNQ (USD) and XRE.TO (CAD), distributions reinvested, October 12, 2021 to October 9, 2026. Each line is in its own currency. Data: Stock Assembler (yfinance).
The two lines move together for most of the period. Both sank through 2022 and into 2023, both rebuilt through 2024 and 2025, and both slipped again toward the end. VNQ simply finishes above its starting line and XRE.TO finishes below it.
Price tells one story, distributions tell another
This is where REIT investors tend to misread things. On price alone, VNQ fell 13.2% and XRE.TO fell 23.9%. A reader looking only at price would conclude both funds destroyed capital and the Canadian one destroyed more.
Reinvested distributions change the picture a lot. For VNQ, they turned a 13.2% price loss into a 5.4% gain. For XRE.TO, they turned a 23.9% price loss into a 3.9% loss. Income did most of the repair work in both funds, which is the whole argument for owning REITs for income. It just did not repair XRE.TO enough.
If you take the distributions as cash and spend them instead, the numbers are less kind: 3.4% for VNQ and a loss of 5.1% for XRE.TO. Reinvesting matters.
The yield gap is real, but it can't be read as a spread
XRE.TO's trailing 12-month yield is 4.7%, paid monthly. VNQ's is 3.8%, paid quarterly. It is tempting to call that a spread and build a story on it.
I wouldn't. One yield is in Canadian dollars and the other in US dollars, and I have no exchange rate in the data to put them on the same footing. The same goes for the returns: each fund's return is in its own currency, so a US investor and a Canadian investor holding the same fund would see different results once currency moves are included. I'm describing each fund against its own start, not subtracting one from the other.
For context on how wide the range gets within US REITs, Realty Income (O), the monthly-paying single stock, yields 6.0% in US dollars. A high yield is a price the market sets for risk, and a fund yielding 3.8% is a very different animal.
What this does not prove
The thesis behind this post was that US and Canadian REITs are diverging because of different rate sensitivity and refinancing schedules. The first half holds up: over five years the US fund beat the Canadian one on both price and total return. The second half I can't support. My data has prices, distributions and yields. It has nothing on debt maturities, refinancing costs or rate sensitivity, so any explanation along those lines is a plausible hypothesis, not something this analysis found.
There is also a fair counter-argument. Five years is one rate cycle, and it started at a high point for both funds. Change the start date and the gap could shrink or flip. A single window is a snapshot, not a law.
What I would check before buying either
First, look at total return, not price, and not yield alone. A higher yield on XRE.TO did not rescue its five-year result.
Second, check which currency you actually spend. If your liabilities are in Canadian dollars, a US fund adds currency exposure on top of REIT exposure, and the return you see in the chart is not the return you get.
Third, run the same comparison over different start dates before trusting any one window. You can run this comparison on any pair of funds in Stock Assembler's Compare Tickers tool.
This post is for informational purposes only and does not constitute financial advice. Return and yield figures from Stock Assembler's Compare Tickers and ticker tools (yfinance data), October 12, 2021 to October 9, 2026, each in the fund's local currency. Past performance does not guarantee future results.