austin
2026-11-09
A Utility Dividend Check: Southern and Duke Spent More on Capex Than Operations Brought In
- Southern and Duke each spent more on capex than operations brought in over nine months, and both still paid dividends.
- Trailing yields for the US names sit at 2.8% to 3.3%, below the 4.84% 10-year Treasury yield on November 5, 2026.
- Five-year total return with dividends reinvested ran from +17.5% for NEE to +76.9% for SO, so reinvested dividends did a lot of the work.
- Enbridge yields 5.8% in CAD, but it is a pipeline company, not a regulated utility, and belongs in a different bucket.
Southern Company and Duke Energy both filed their Q3 2026 10-Qs on November 5, 2026, and the cash flow statements tell the same story. Each company spent more on building the grid and the plants than its operations brought in.
A utility dividend is only as safe as the balance sheet that funds it and the regulators who allow it to earn a return. The yield alone tells you very little. This is an evergreen check using the latest filings, not a reaction to news: the quarterly dividends were routine.
The mechanic: dividends paid from borrowed headroom
Regulated utilities invest heavily, then recover the cost through rates approved by regulators. Until that recovery arrives, free cash flow is usually negative, and the gap is funded with debt. A dividend can be perfectly sustainable in that setup. It just depends on lenders and regulators staying cooperative.
Here is what the filings show for the nine months ended September 30, 2026, in USD millions.
| Item | Southern (SO) | Duke (DUK) |
|---|---|---|
| Net cash from operations | 7,880 | 7,889 |
| Capital spending | 10,200 | 12,566 |
| Dividends paid | 2,399 | 2,555 |
| Long-term debt, September 30, 2026 | 69,498 | 84,332 |
| EPS, nine months (USD) | 4.00 | 5.34 |
For both companies, capex is larger than operating cash flow before a dollar goes to shareholders. Southern's quarterly dividend declared was 0.74 in Q1 and 0.76 in Q2 and Q3. Duke declared 1.085 per share in Q3 and 3.215 over the nine months. Neither filing points to a cut. What the numbers show is a dividend that rides on continued access to debt markets.
This post covers the cash flow, capex, dividend and debt lines only. Payout ratios, net debt and open rate cases are the next things to check, and they are left for you to pull from the filings.
The yield is below the Treasury, and that is the point
The US 10-year Treasury yielded 4.84% on November 5, 2026. Trailing 12-month yields were 3.2% for SO, 3.3% for DUK, 2.8% for NEE and 2.8% for XLU, the utilities sector fund. All four sit below the Treasury. The old bond substitute pitch no longer holds on yield alone: you take equity risk, leverage and regulatory risk for less current income than a government bond pays.
The case for owning them has to rest on dividend growth and total return.
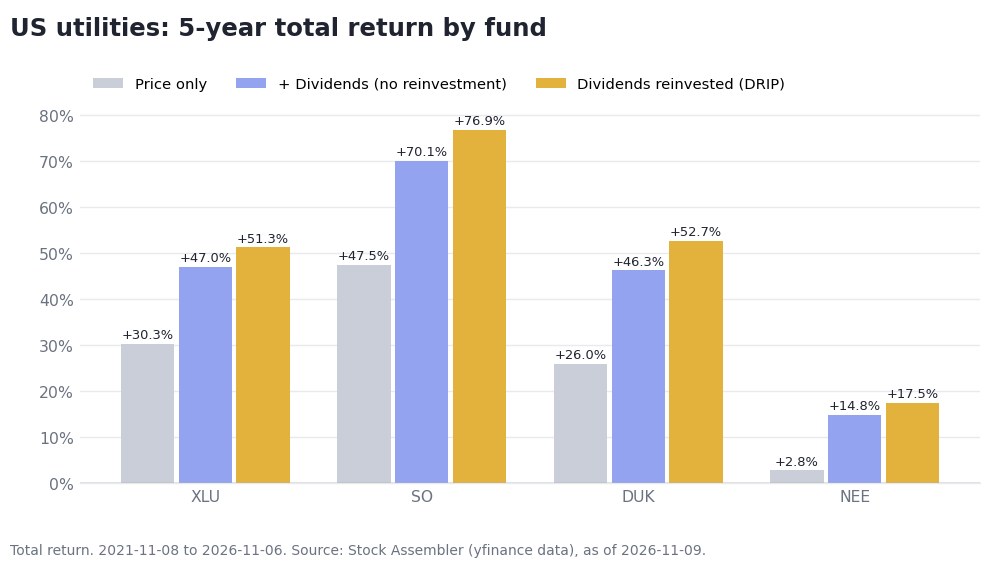
US utilities, five-year total return in three modes: price only, dividends without reinvestment, and dividends reinvested. November 8, 2021 to November 6, 2026. Data: Stock Assembler (yfinance).
With dividends reinvested, SO returned +76.9% (price only +47.5%), DUK +52.7% (price only +26.0%), XLU +51.3% (price only +30.3%) and NEE +17.5% (price only +2.8%). The middle bar for each fund shows dividends taken as cash without reinvestment, sitting between the two. NEE is the cautionary case: the price barely moved over five years, and dividends carried most of the return. DUK's price return of +26.0% became +52.7% once dividends were reinvested, which shows how much of the story a quote screen misses. Compare SO vs DUK on Stock Assembler.
Over the last year the picture was calmer. XLU returned -1.1% with dividends reinvested (price only -3.8%), SO +5.1% (price +1.7%) and DUK +7.6% (price +3.9%).
Canada: higher yields, and a pipeline that is not a utility
Canadian figures are in CAD, so keep them apart from the US numbers above. The Government of Canada 10-year yield was 3.67% on November 5, 2026. Trailing 12-month yields were 3.0% for Fortis (FTS.TO) and 4.1% for Emera (EMA.TO). Fortis sits below the Canadian bond yield and Emera above it.
Enbridge (ENB.TO) yields 5.8% in CAD, the highest figure in this post. I would not file it with the utilities: it is an energy infrastructure company whose pipeline cash flows come from different contracts and carry different risks.
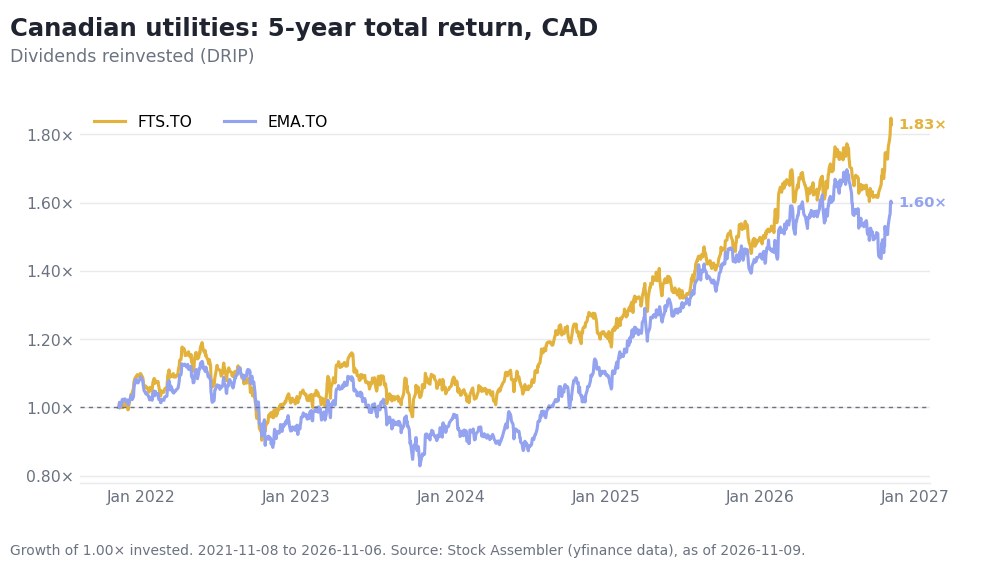
Fortis and Emera, five-year total return with dividends reinvested, in CAD. November 8, 2021 to November 6, 2026. Data: Stock Assembler (yfinance).
In CAD, Fortis returned +82.8% with dividends reinvested (price only +51.1%) and Emera +59.9% (price only +23.2%). Compare FTS.TO vs EMA.TO on Stock Assembler.
What I would check before trusting a utility dividend
The strongest counter-argument is that none of this signals trouble. Neither filing shows a dividend cut, and negative free cash flow is the design of a regulated utility, not a defect. I agree with that. But it means safety is a judgment about the next financing and the next rate decision, and the yield spread to the Treasury cannot make that judgment for you.
Pull the latest 10-Q for any utility you hold and look at four lines: operating cash flow, capex, dividends paid and long-term debt. Then read the regulatory section for open rate cases. Finally, check how much of your portfolio's income comes from rate-sensitive sectors, since that is the real concentration question. Stock Assembler's sector weights and yield per holding show that split in one place.
This post is for informational purposes only and does not constitute financial advice. Company figures from Southern Company and Duke Energy Q3 2026 10-Qs filed November 5, 2026. Treasury yield from FRED (November 5, 2026); Canada 10-year from the Bank of Canada (November 5, 2026). Yield and return figures from Stock Assembler (yfinance data), November 8, 2021 to November 6, 2026; one-year figures November 10, 2025 to November 6, 2026. Past performance does not guarantee future results.