austin
2026-05-04
The Yield Number That's Lying to You
If you've held QYLD, the trailing 12-month yield of 11.5% looks compelling. The total return over that same period tells a materially different story. SCHD's 3.5% today was built on a decade of dividend growth from holdings that also appreciated in value. These are different income machines, and they belong in different parts of a portfolio depending on your phase of life.
The Number That Pulls You In
QYLD at 11.5%. XYLD at 9.2%. JEPI at 8%. SPYI at 12%. QQQI at 14%. Versus SCHD at 3.5%. If you read those numbers and felt a pull toward the first column, you're not alone, and that pull is exactly what this post is about.
The yield number on a covered call ETF and the yield number on a dividend growth ETF are not the same thing. They look the same on a screen. They land in your account the same way. But they come from fundamentally different places, and conflating them is one of the most expensive category errors an income investor can make.
Where the Income Actually Comes From
Dividend growth ETFs like SCHD distribute income derived from the cash flows of profitable, growing businesses. When the underlying companies raise their dividends, your income grows. The 3.5% yield today was ~2.8% five years ago on the same shares.
Covered call ETFs distribute option premium: money collected by selling away the right to participate in the upside of their holdings beyond a certain price. That is a real income source: it's not fake. But it behaves very differently than a dividend.
Here's the mechanism: when markets get volatile, option premiums spike. A higher VIX means the fund collects more when it writes calls. For example, with Brent crude sitting at $100–$108/bbl and a packed macro calendar keeping traders on edge, covered call ETFs like QYLD and XYLD are collecting elevated premiums relative to calmer periods. The income is genuinely higher right now. The problem isn't that this income is illusory. The problem is what you give up to get it.
The Price You Pay in a Rising Market
Every dollar of option premium a covered call ETF collects comes at the cost of upside participation. When the market rallies past the strike price, the fund's gains are capped. The call option buyer pockets the difference. You got your premium; they got your bull market.
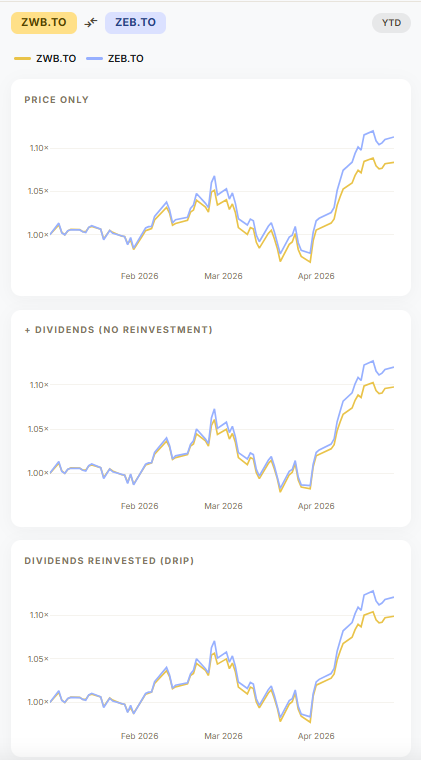
The Canadian bank sector makes this concrete. Year-to-date, Canadian banks have staged a meaningful recovery. ZEB.TO (the equal-weight Canadian bank ETF with no options overlay) has captured that rally. ZWB.TO, its covered call counterpart, has lagged. The premiums softened the downside earlier in the year, and then capped the upside when the banks ran. That's the trade-off in plain numbers.
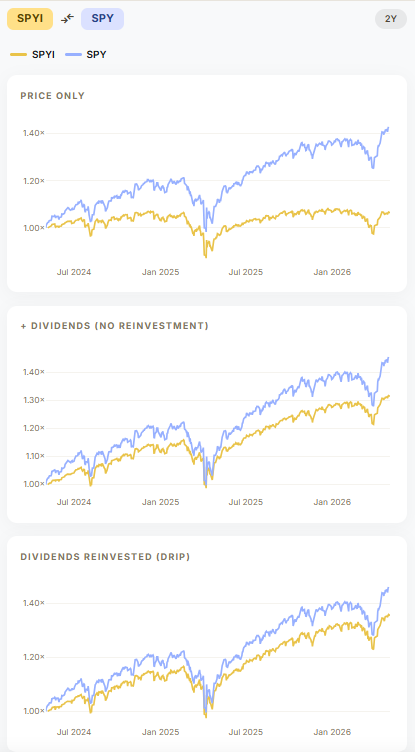
A post by @dividendology on X on May 1, 2026 framed a $1M covered call ETF position as generating "$119,000/year from SPYI" versus "$35,000/year from SCHD." The math is accurate. The framing is incomplete. That SPYI position also missed a meaningful portion of the equity gains, as seen on the comparison chart over 2 years above. Unlike SCHD's distributions, the option premium component of SPYI's yield fluctuates with market conditions rather than growing with corporate earnings.
That said, the story isn't one-sided. The same structure that caps your upside also cushions your downside. That cushion has real value depending on what you need from your portfolio.
The Fair Counterargument
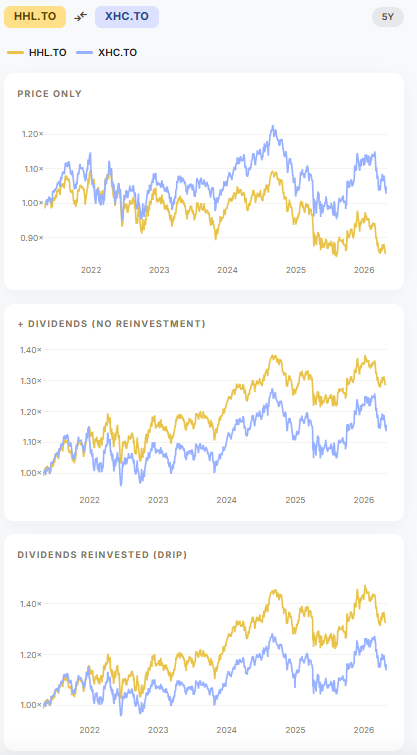
In flat or slowly declining markets, premium income provides a real cushion that a dividend growth ETF simply can't match. The stagging healthcare market over the last 5 years made this case compellingly: when equities go sideways or slightly bearish, covered call strategies held up meaningfully better because premium income partially offset NAV declines. Please see the 5 year chart comparison between HHL.TO (Harvest Healthcare Leaders Income ETF) vs XHC.TO (iShares Global Healthcare Index ETF, CAD Hedged).
If you're drawing down regularly from your portfolio and need consistent monthly cash flow, the smoothing effect of that income has psychological and practical value that a total return chart doesn't fully capture.
The error isn't owning covered call ETFs. The error is using their yield number as an apples-to-apples comparison to a dividend growth ETF, then allocating heavily to the higher number without understanding what you've traded away.
The Hidden Cost: What NAV Erosion Actually Means
Here's something most covered call ETF holders never look at closely enough. Some of these funds, particularly in flat or down markets, don't generate enough option premium to fully fund their stated distribution. To keep the yield figure looking attractive, they make up the shortfall by returning investors' own capital, a practice called return of capital (ROC).
Think of it this way: imagine you put $10,000 in a jar, and every month someone hands you $100 from that same jar and calls it "income." The jar is getting smaller. That's not income. That's your own money coming back to you in smaller pieces. The yield number looks fine. The jar doesn't.
Over time, this quietly shrinks the base that future distributions are calculated on, which means the fund has to work harder just to maintain the same payout. It's a slow erosion that a trailing yield figure will never show you.
What You Should Actually Be Tracking
Yield is one column in a spreadsheet. The relevant columns are yield, NAV change, and total return: all three, over a timeframe that includes both bull and flat markets.
If you've held QYLD since 2022, the trailing 12-month yield of 11.5% looks compelling. The total return over that same period tells a materially different story. SCHD's 3.5% today was built on a decade of dividend growth from holdings that also appreciated in value. These are different income machines, and they belong in different parts of a portfolio depending on your phase of life.
The Question Worth Asking
Before your next allocation decision, ask this: am I buying this yield because I understand the trade-off, or because 11.5% reads better than 3.5%?
The covered call mechanism is legitimate. The volatility-to-premium relationship is real and currently running hot. But income investors who allocate based on the yield number alone — without accounting for capped upside, NAV sensitivity, and distribution variability — will eventually be surprised. Usually in a bull market, when everyone else's portfolio is doing the thing theirs isn't, at least not as much.
That's not a reason to avoid covered call ETFs. It's a reason to know exactly what you own.
This post is for informational purposes only and does not constitute financial advice. Always do your own research before making investment decisions.