austin
2026-05-18
Pairing Healthcare Covered Call ETFs with Tech Growth Stocks
The Strategy at a Glance
This portfolio pairs two deliberate choices: covered call ETFs for healthcare exposure, and direct stock ownership for technology. The healthcare covered call ETFs such as HHL.TO or LIFE.TO generates consistent monthly income from a sector whose price hasn't moved meaningfully in years. The technology sector stocks (GOOG, META, AMZN, MSFT, and AMD) captures the capital appreciation that a covered call overlay would cap. Together, they create a portfolio that collects income from one sector's stability while participating fully in another sector's growth.
Why Healthcare With Covered Call Strategy
Healthcare is one of the most intuitive defensive sectors to own. Demand is structurally non-cyclical: hospital visits, prescription drugs, and medical devices don't get deferred because the stock market is volatile or the economy slows. That defensiveness earns healthcare its reputation as a resilient allocation, particularly in uncertain macro environments like the current one.
The paradox is that this same defensiveness has suppressed price appreciation. Over the past five years, the healthcare sector has been a consistent underperformer relative to the broader market. Drug pricing regulation risk, post-COVID normalization of pandemic-era demand, and the sector's absence from the AI-driven earnings re-rating that lifted technology have all contributed to a prolonged period of price stagnation. Owning healthcare stocks directly has meant collecting modest dividends while watching the index mark time.
A covered call strategy changes the calculus entirely. When a sector isn't generating meaningful capital gains, you sacrifice very little by selling call options against it: the most of the upside you're capping through selling option premium wasn't going to materialize anyway. What you gain is the option premium, which, in a volatile macro environment, can be substantial. Specific ETFs of interest include HHL.TO, which currently yields approximately 10.65% per annum, distributed monthly. Another ETF is LIFE.TO, which yields approximately 13.37% per annum, also monthly. Both funds are generating that income from a sector whose underlying price has been essentially flat, which is precisely what makes the covered call structure so well-suited here.
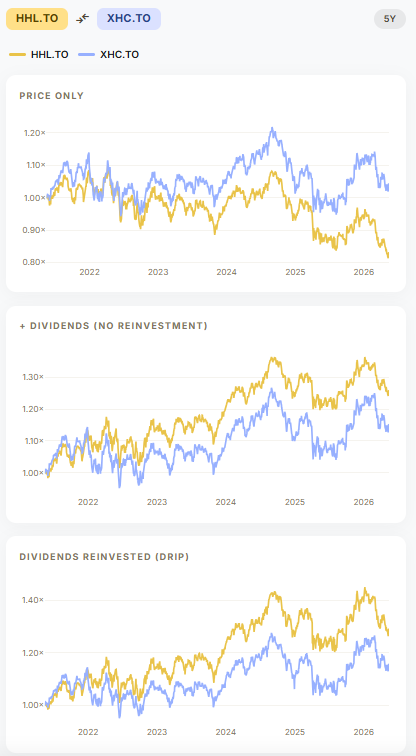
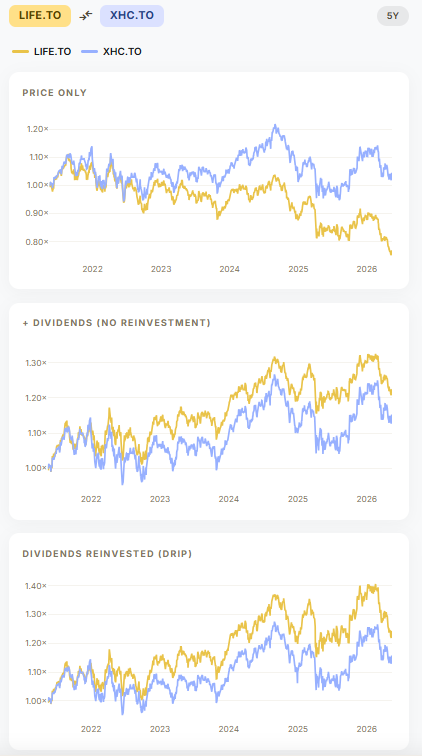
The comparison against XHC.TO, which is the plain-equity global healthcare ETF by iShares in TSX, makes the case visually. Both HHL and LIFE have outperformed their unoptioned counterpart on a total return basis (i.e. price + dividend, or with dividend reinvested) over this period, precisely because the covered call premium has compensated for the sector's lack of price momentum. In a sector that isn't going anywhere, income is the return.
Why Hold Technology Stocks Directly
Technology is the opposite case. The AI growth trend running through GOOG, META, AMZN, MSFT, and AMD represents a long-duration capital appreciation story. These companies are compounding earnings, expanding margins, and benefiting from a structural shift that may still be in its early innings. A covered call overlay on this exposure would systematically cap the upside that is the entire reason to own these names.
The covered call tech ETF category makes this concrete. For example, HTA.TO, one of the better-performing covered call tech ETFs, are available to Canadian investors in TSX, has broadly tracked QQQ over multi-year periods, occasionally coming close or beating on total return. But it gets there by trading away price appreciation for distribution income. The net asset value compounds more slowly; the monthly income compensates the growth. For investors who don't need current income from their technology allocation, they may not want to necessarily hold covered call ETF in technology sector.
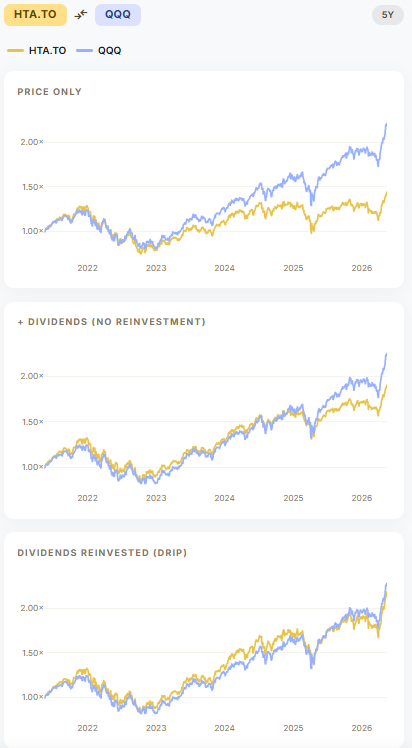
The takeaway is not that covered call tech ETFs are bad instruments. It's that they solve a different problem. If you want technology exposure and you need it to pay you monthly income, HTA makes sense. If you want technology exposure and you want to maximize long-term total return, direct ownership of the underlying names is the right structure. This portfolio chooses the latter.
What the Portfolio Looks Like, and How It Has Performed
Three allocations were run against a five-year backtest, each reflecting a different balance between income and growth:
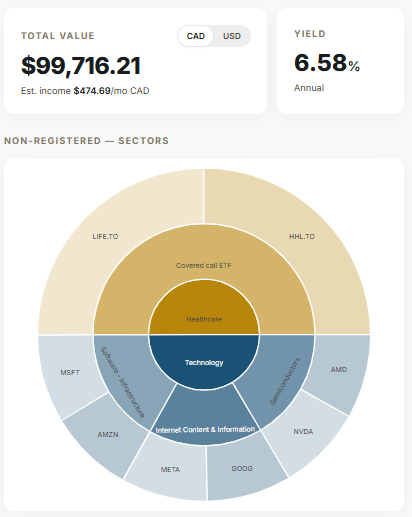
- 50:50 — equal split between healthcare covered calls and tech stocks. Portfolio size: ~$100,000 CAD. Overall portfolio yield: 6.58% per annum.
- 33:67 — one-third healthcare, two-thirds tech. Portfolio size: ~$75,000 CAD. Overall yield: 4.70% per annum.
- 67:33 — two-thirds healthcare, one-third tech. Portfolio size: ~$150,000 CAD. Overall yield: 8.26% per annum.
The yield relationship is linear and intuitive: every shift toward healthcare covered calls adds income, every shift toward technology adds price appreciation potential. What the backtest makes visible is how that trade-off actually played out over five years.
The pattern across all three charts is consistent: the price-only line and the price-plus-distributions line track closely at first, then diverge meaningfully over time as cumulative distributions compound.
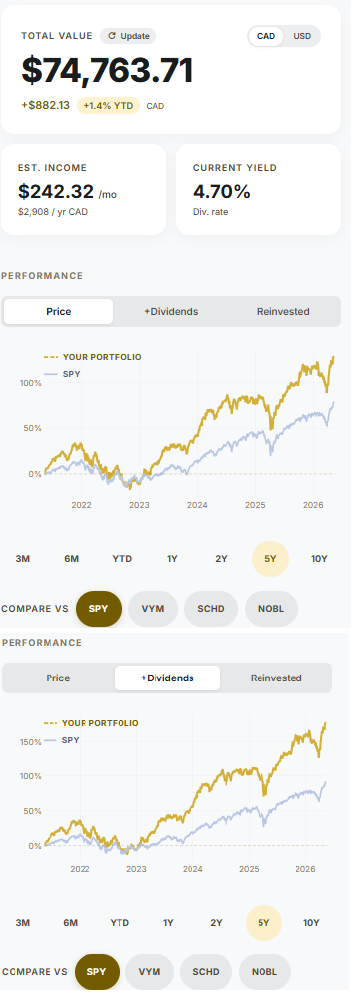
The 33:67 growth-heavy allocation are driving the overall asset value appreciation that the income-heavy portfolio doesn't match. In a sustained tech bull market, that price appreciation is the real gain in the overall value of the portfolio, while collecting modest yield of ~4.7% from the overall portfolio.
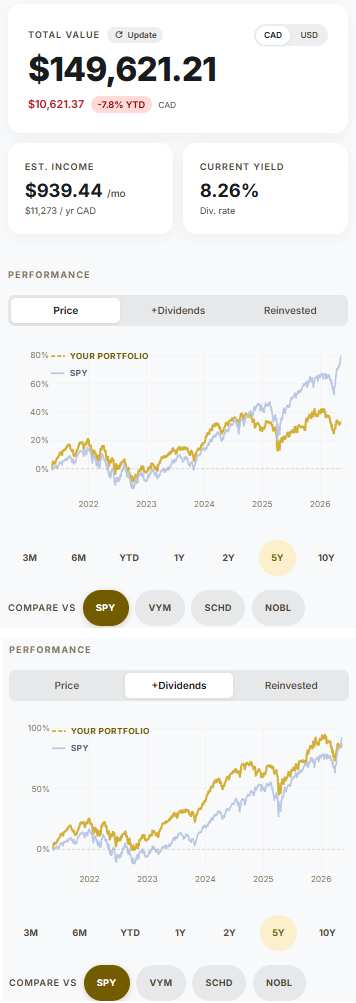
The 67:33 income-heavy allocation is where the distribution advantage is most visible. At 8.26% annual yield, the monthly income is substantial and consistent. The incomes arrives regardless of what the technology sector is doing in any given month. The price-only line grows more modestly than the other two allocations, reflecting the reduced tech weighting. But the price-plus-distributions line tells a more competitive story: five years of compounding monthly healthcare premium closes a meaningful portion of the price appreciation gap. For investors whose primary objective is reliable monthly cash flow — retirees drawing down, or anyone who needs the portfolio to pay regular income — this allocation makes the strongest practical case.
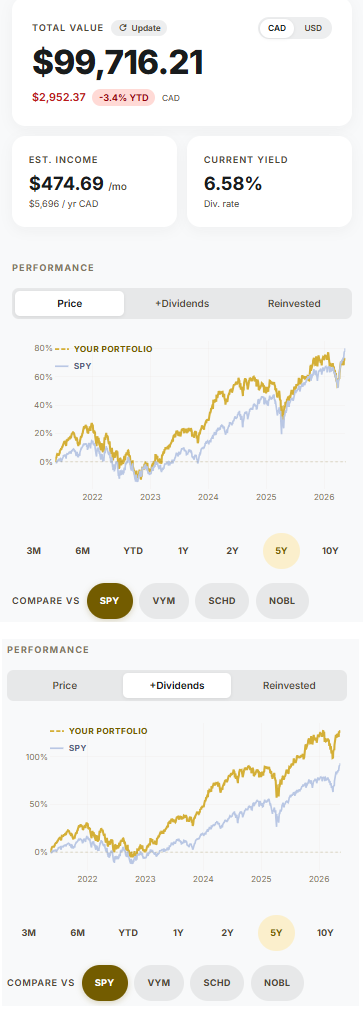
The 50:50 split sits between both extremes: meaningful income separation from price-only over time, alongside enough tech exposure to participate in the sector's appreciation. For investors who want the balance of regular income while enjoying modest capital gain growth, the 50:50 portfolio can be the most balanced entry point into this strategy, which is not a surprise.
This post is for informational purposes only and does not constitute financial advice. Yield figures for HHL.TO and LIFE.TO sourced from fund distributor pages as at April–May 2026. All performance data sourced from StockAssembler using historical price and distribution data. Past performance does not guarantee future results.